Quality Improvement Tools in Excel
Save Time on Improvement Projects Using QI Macros add-in
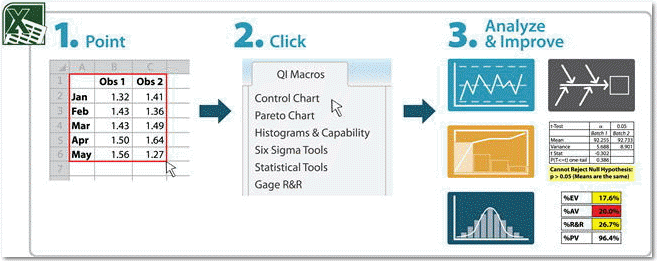
Just select your data, click on the QI Macros menu and QI Macros will do the math, and draw the Six Sigma charts for you.
List of the Templates, Tools and Charts in QI Macros
Chart and Statistics Wizards
Planning Tools
- Action Plan
- 30-60-90 Day Action Plan
- Affinity Diagram
- Arrow Diagram
- Balanced Scorecard (Tree)
- Blue Ocean Strategy
- Check List | AIAIG Checklist
- Checksheet
- Convert PPM to Cp-Cpk
- DPMO Six Sigma Calculator
- EOQ Calculator
- Gantt Chart
- Hoshin Kanri
- L, T, X Shaped Matrix
- Mind Mapping
- North Star Metric
- PEST
- Project Charter
- RACI
- Rolled Throughput Yield Calculator
- ROI Calculator
- SIPOC
- Stakeholder Analysis
- SWOT
- Targets and Means Matrix
- Transition Planning
- Tree Diagram
- Voice of the Customer
Improvement Tools
- 8D Report (Ford)
- A3 Report (Toyota)
- Action Plan
- Block Diagram
- Costs of Poor Quality ("Calculators" drop-down)
- Cost of Quality
- Countermeasures
- Defect Tracking Template
- Fault Tree
- Flow Chart
- Force Field Analysis
- Hazard Analysis - Bow Tie
- Ishikawa Fishbone Diagram
- Measurement Matrix
- Non-Parametric Tests
- Pareto Chart
- PDPC Chart
- Test of Proportion
- QI Story
- Relationship/Systems Diagram
- Risk Assessment Matrix
- Time Tracking
- Tree Diagram
- TRIZ Template
- Turtle Diagram
- Weighted Risk Matrix
Flow Charts and Fishbones
- Block Diagram
- Fault Tree
- Flow Chart
- Ishikawa Fishbone Diagram
- Spaghetti Diagram
- Tree Diagram
- Value Stream Map
SPC Control Charts
Attribute Control Charts
- c Chart Template
- np Chart Template
- p Chart Template
- u Chart Template
- g Chart Template
- c, p, u, np Dashboard
Variable Control Charts
- XmR Dashboard
- XmR Four Pak
- XmR + USL, LSL, Target
- XmR 30000-foot
- XmR Autocorrelated
- X bar R
- X bar S
- X Median R
Options within most control chart templates:
- Center Line Based on Average
- Center Line Based on Median
- Templates to Handle Rolling Data
- Control Chart with Fixed or Historical Control Limits
SPC Charts Other Control Charts
- Cusum
- Bollinger Bands Chart
- EWMA
- Hotelling T2 Individuals
- Levey Jennings QC Chart
- M Chart
- Moving Average
- PreControl Chart
- q Chart Template
- t Chart Template
AIAG and ISO
- APQP Checklists
- Control Plans
- Failure Prevention Analysis Template
- FMEA, DFMEA and PFMEA
- Gage R&R with range method, anova method, bias, nested, linearity, attribute Gage R&R study, and Gage R&R Type 1.
- PPAP Forms - AIAG 4th Ed
- Pre Control Chart
- Uncertainty ISO 17025
DFSS, DOE, MSA
- Design of Experiments (Plackett-Burnham 2-3-4 Factor and Taguchi 4-8-9-12-16)
- FMEA, DFMEA, and PFMEA
- Gage R&R range method, anova method, bias, linearity, and attribute
- Pugh Concept Selection Matrix
- QFD House of Quality
Lean Tools
- Heijunka Board
- Lean Scorecard
- Lean 5S Scorecard
- Lean 5S Cleaning Assessment
- Lean Takt Time and NVA
- MODAPTS Template
- Time Tracking Tool
- Value-Added Flow Analysis
- Value Stream Map
- Yamazumi Chart
Project Management Tools
- Action Plan
- Affinity Diagram
- Arrow Diagram
- Check List | AIAIG Checklist
- Checksheet
- Cost of Poor Quality Matrix
- Cost of Quality
- Driver Diagram
- Driver Matrix
- Earned Value Management Formulas
- Fishbone Diagram or Ishikawa Diagram
- Flow Chart
- Gantt Chart
- Measurement Matrix
- Resource Matrix
- ROI Calculator
- SIPOC
- Stakeholder Analysis
- Time Tracking Tool
- Tree Diagram
- Voice of the Customer
- Work Breakdown Structure
Other Charts
- Binomial Capability Analysis
- Box and Whisker Plot
- Cp, Cpk Template
- Delta Chart
- Histogram
- Kaplan-Meier Step Plot
- Pareto Chart
- Poisson Capability Analysis
- Probability Plot
- ROC Curve
- Run Chart
- Scatter Plot Diagram
- Speedometer Chart
- Stem and Leaf Plot
- Target and Line Chart
- Titration Curve Chart
- Tornado Chart
- Values/Variation Plot
- Youden Plot
Statistical Analysis
Data Normality
Hypothesis Tests
Test of Means
- One Way ANOVA
- One Way ANOVA Post Hoc
- Two Way ANOVA Without Replication
- Two Way ANOVA With Replication
- Two Way ANOVA Nested with Replication
- ANCOVA
- MANOVA
- One Sample t Test
- Paired t Test - Two Sample for Means
- Two Sample t Test (Equal and Unequal Variances)
- z-test Two Sample for Means
- Equivalence Test
- Equivalence (TOST) Test - Paired Data
- Two One Sided Test for Equivalence (TOST)
Test for Outliers
Test of Variances
Test of Proportions
Test Relationship
- Adjusted R Squared
- Autocorrelation
- Box Cox Transformation
- Johnson Transformation
- LogNormal Data Transformation
- Yeo-Johnson Transformation
- Chi-square Contingency Table
- Chi-square Goodness of Fit
- Correlation
- Covariance
- Crow-AMSAA
- Descriptive Statistics
- Fisher Exact Test
- Regression Analysis
- Multiple Regression Analysis
- Logistic Regression (Binary)
- Binomial Logistic Regression
- Multinomial Logisitic Regression
- Deming Orthogonal Regression
Non-Parametric Tests
- 1-sample sign test
- Friedman test
- Kolmogorov-Smirnov test
- Kruskal-Wallis test
- Mann-Whitney test
- Mood's Median test
- Sign test
- Spearman test
- Tukey Quick test
- Wilcoxon Rank Sum test
- Wilcoxon Signed Rank test
Sampling
Purchase QI Macros SPC Software for Excel through our secure shopping cart or try a free, QI Macros 30-day trial!
Join 100,000+ Users
in 80 Countries


KnowWare International, Inc.
2696 S. Colorado Blvd., Ste. 555
Denver, CO 80222 USA
Toll-Free: 1-888-468-1537
Local: (303) 756-9144
©
1997 - 2026 KnowWare International Inc. All Rights Reserved. Legal Info | Terms of Use