Trying to Create Moving Average Control Charts in Excel?
QI Macros can create them for you!
Draw a Moving Average Chart using QI Macros
- Select your data.
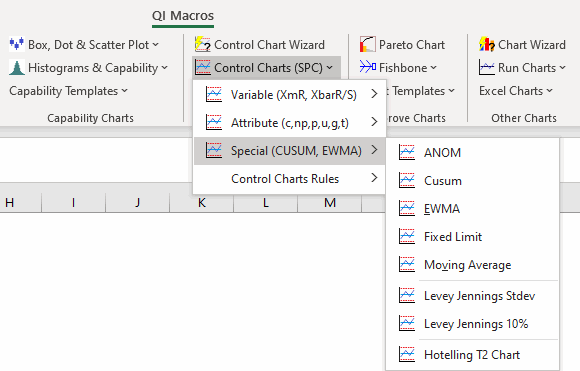
- Click on QI Macros menu > Control Charts (SPC) > Special > Moving Average.
- QI Macros will do the math and draw the chart for you.
Use Moving Average Charts to evaluate process shifts using a simple Moving Average.
Use an EWMA chart for Exponentially Moving Averages.
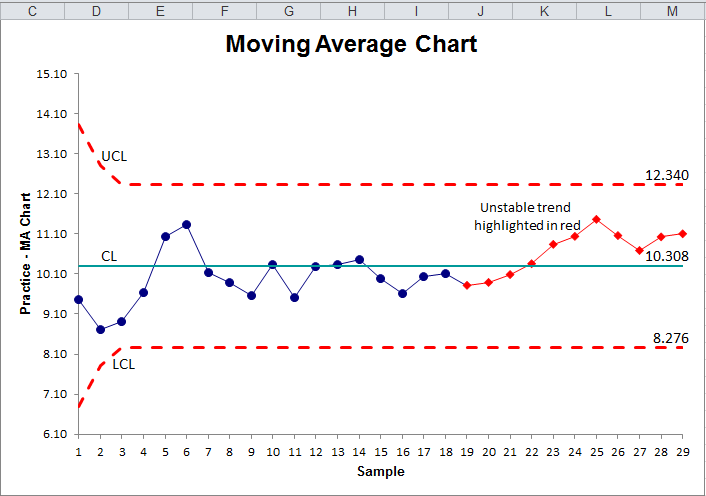
Example of a Moving Average Chart created using QI Macros for Excel.
To create a Moving Average Chart using QI Macros
- Select your data and run the Moving Average Chart macro found in Control Charts (SPC) > Special (CUSUM, EWMA):
- QI Macros will perform all of the calculations and will create a Moving Average Control Chart for you.
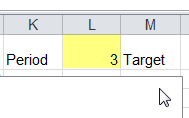
Note: The Moving Average Period default in QI Macros is set at 3.
You can change the length of the moving average period (how many points are used when calculating your moving average), by changing the value in cell L1. If L1 is covered by the chart, just click on the chart and move it out of the way.
QI Macros also has a Moving Average Chart Template. It is helpful if you are still gathering your data.
Stop Struggling with Moving Average Charts!
Start creating your Moving Average Charts in just minutes.
Download a free 30-day trial. Get Moving Average Charts now!
QI Macros Draws These Charts Too!
