Changing Control Chart Rules in QI Macros
Control Chart Rules for determining unstable points and conditions vary among the experts. QI Macros lets you select from among industry standards including Montgomery, Nelson-Juran, Westgard, AIAG, Western Electric and rules used in Healthcare. You can also create custom rules.
QI Macros Control Chart Rule Options
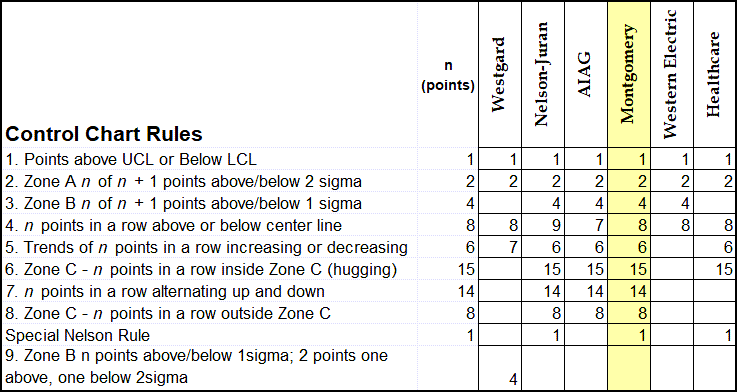
NOTE: QI Macros default rules are the Montgomery rules from Introduction to Statistical Process Control, 4th edition pp 172-175, Montgomery.
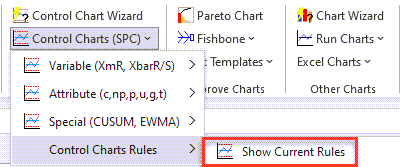
To view the Control Chart Rules that are currently enabled, select "Show Current Rules" from the Control Charts (SPC) > Control Charts Rules menu:
How to Change Control Chart Stability Rules in QI Macros
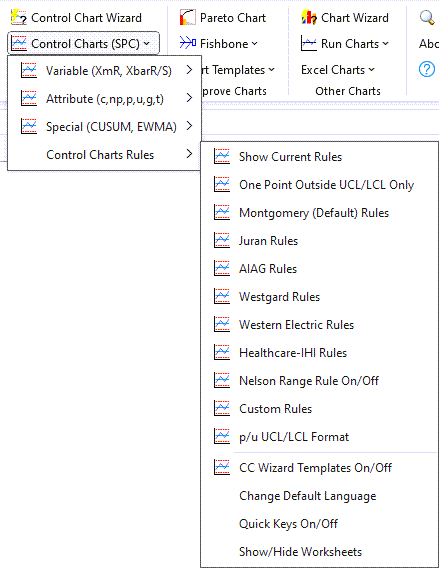
- Click on the QI Macros menu, Control Charts (SPC), and then Control Charts Rules:
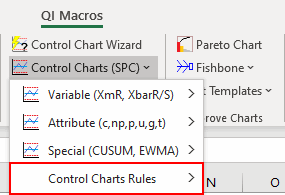
- Select the control chart rules you want to use. Depending on how fast your version of Excel is, you should see QI Macros updating the rules file.
- Now just run a chart and the new rules will be applied.
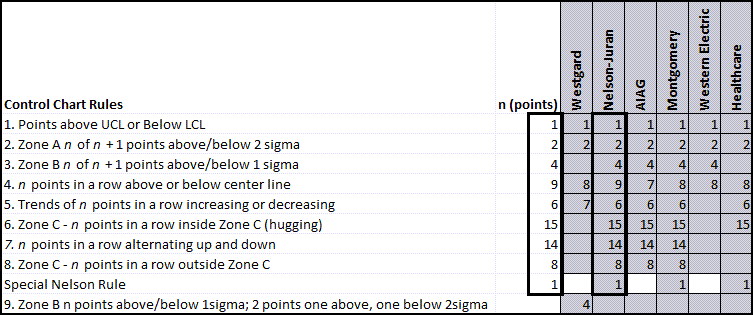
- To check which rules are active, click on QI Macros, Control Charts (SPC), Control Charts Rules and then "Show Current Rules." The active rules will be shown in the column labeled "n (points)." In the example below, you can tell that Juran's rules are active because the values in the "n (points)" column are equal to Juran's rules:
- Any changes made to the rules are "permanently" made. The rules will not reset if you close and reopen Excel or shut down and start up your computer.
- To reset the rules to the defaults or to another set of rules simply click on the Control Charts Rules menu and select a new set of rules or Montgomery (Default) Rules to go back to the default.
How to Create Custom Control Chart Rules in QI Macros
You can set your own custom stability rules using QI Macros as follows:
- Open Excel and then open a blank workbook/spreadsheet.
- Next, for PCs, open the Control Chart Rules file in:
My Documents\QI Macros Test Data\ControlChartRules.xlsx
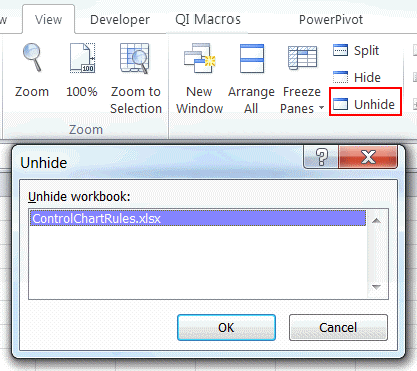
- The file will open, but it will be hidden in Excel. To unhide the file in Excel 2013-2021 and Office 365 (PC) -or- Excel 2019, 2021, and Office 365 (Mac), select "View" then "Unhide":
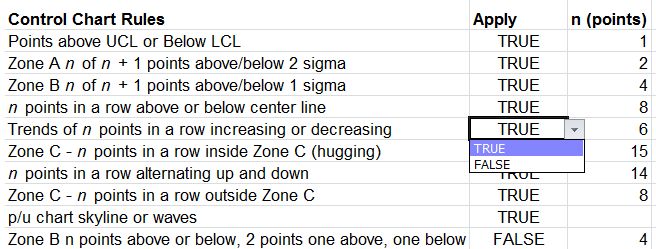
- The control chart rules file will allow you to turn a stability test off by changing the value in the Apply rule column from True to False. Just click on a cell and change the value using the pull down arrow:
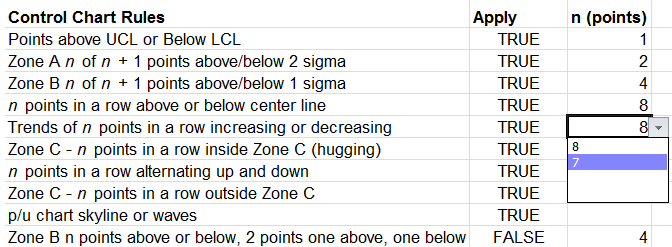
- You can also change the number of points required for each test by changing values in the n (points) column. To do so, either enter in the specific number you would like the n (points) value to be, or click into the cell and select one of the options using the pull down arrow:
- After you make your changes, save the Control Chart Rules file, re-hide it (View > Hide) and then completely close and re-open Excel. If prompted to save the Control Chart Rules file again, select "Save."
Note: Changes will not take effect until you close and re-open Excel. - Once you have re-opened Excel, select Control Charts (SPC) > Control Charts Rules, and click "Custom Rules." And once you have done so, select the Control Charts (SPC) > Control Chart Rules drop-downs, and click "Show Current Rules" - you should now see your custom rules listed as the current rules:
- To switch back to the default rules, click on the QI Macros menu and select Control Charts (SPC) > Control Charts Rules > Montgomery (Default) Rules. Once you have done so, close and re-open Excel.
If there isn't one in that location, use:
C:\Program Files\QI Macros\TestData\ControlChartRules.xlsx
If there isn't one in that location, use:
C:\Apps\MIQ2202\ControlChartRules.xlsx
If there isn't one in that location, use:
C:\Program Files\QI Macros\xlstart\QITemplates\ControlChartRules.xlsx
For Macs, open the Control Chart Rules file in:
Documents\QI Macros Test Data\ControlChartRules.xlsx
If there isn't one in that location, contact our support team.
Note: Do not delete the "n (points)" values from your Control Chart Rules. If you prefer to not use specific rules, use the "FALSE" toggle option described in Step 5.
Unable to enter your own "n (points)" values?
Note: If your custom rules are not listed, go into Excel and open the Control Chart Rules file from the location provided in step 2. After opening, unhide the file - are your custom rules still listed? If not, re-enter your rules, choose Save, View > Hide, close Excel and reopen. Select "Custom Rules" and then "Show Current Rules" from Control Charts (SPC) > Control Charts Rules - your custom rules should now be the current Control Chart Rules.
If you are not able to update your Control Chart Rules values accordingly, because there are preset drop-down values only available in the file, highlight cells AN2:AN11 in the n (points) column and select Data > Data Validation.
- You will receive a prompt that says, "Erase current settings and continue?" Select "OK"
- Next, click the "Clear All" button in the bottom left of the window that opens and then select "OK" - the preset drop-downs will no longer be included in your Rules file.
Learn More
- Control Menu Options for Stability Analysis
- Control Chart Limit Calculations
- Show/Don't Show 1 & 2 Sigma Lines
Stop Struggling with Control Charts!
Start creating your Control Charts in just minutes.
Download a free 30-day trial. Get Control Charts now!
Other Charts Included in QI Macros for Excel

