Want to Create a t Chart in Excel?
QI Macros can create t charts for you in seconds!
Create a t Chart using QI Macros
- Select your data.
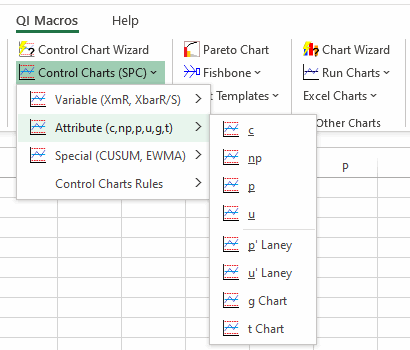
- Click on QI Macros menu > Control Charts (SPC) > Attribute > t.
- QI Macros will do the math and draw the graph for you.
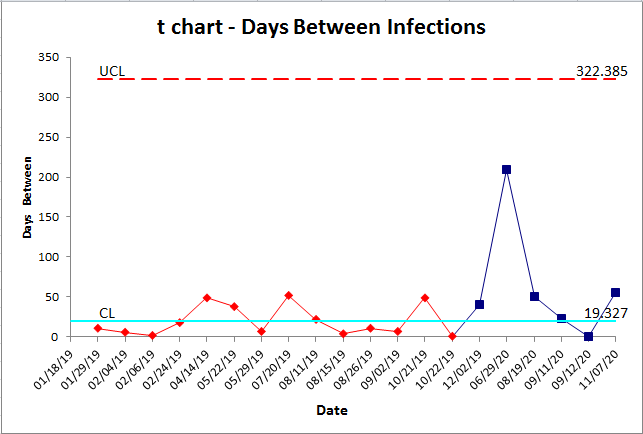
Use a t Chart to analyze the time between rare events
The t Chart is used to evaluate process stability when analyzing the time between rare events. For example, never events in healthcare such as retained foreign objects during surgery. (See QI Macros Test Data/healthcare spc.xlsx).
t Chart example created by QI Macros for Excel
To create a t Chart in Excel using QI Macros:
- Just click and drag over the data to select it.
- Then click on the QI Macros menu, Control Charts > Attribute, then t Chart.
- QI Macros will do all the math and draw the t Chart for you. QI Macros will also turn any unstable points or conditions on the t Chart red. These should be investigated.
QI Macros also has a ready made t chart template for Excel.
Stop Struggling with t Charts!
Start creating your t Charts in just minutes.
Download a free 30-day trial. Get t Charts now!
QI Macros Draws These Charts Too!
