Need to create a Laney u' Chart | u Prime Chart in Excel?
QI Macros can draw one for you in seconds!
Draw a u' Chart using QI Macros
- Select your data.
- Click on QI Macros menu > Control Charts (SPC) > Attribute> u' Laney.
- QI Macros will do the math and draw the graph for you.
When should you use a laney u' chart?
The purpose of a u Chart is to determine stability of "counted" data (e.g., errors per bill, dents in a car door, etc.) when there can be more than one defect per unit and the sample size varies. The u chart will work for most data sets.
However, if your data meets certain criteria, you may need to consider an XmR Chart or a Laney u' Chart (u Prime).
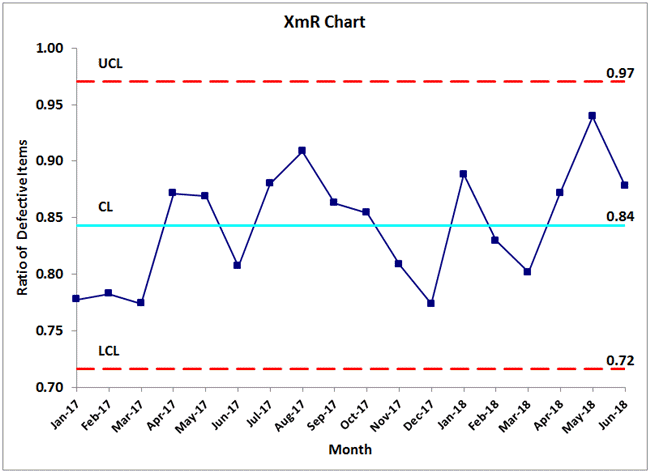
- Consider an XmR Chart if the denominator does not vary widely from sample to sample. And your u chart control limits seem too narrow for the data and most points are highlighted as unstable. See below example.
- Consider a Laney u' Chart (u Prime) if: the sample sizes in your denominator are large and vary greatly.
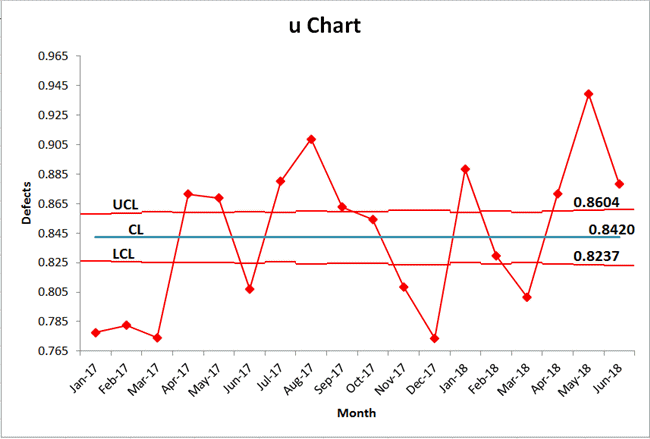
Compare a u chart to an XmR chart on the same data
The control limits on this u chart seem too narrow for the data and all points are considered unstable.
Here is an XmR Chart run on the same data:
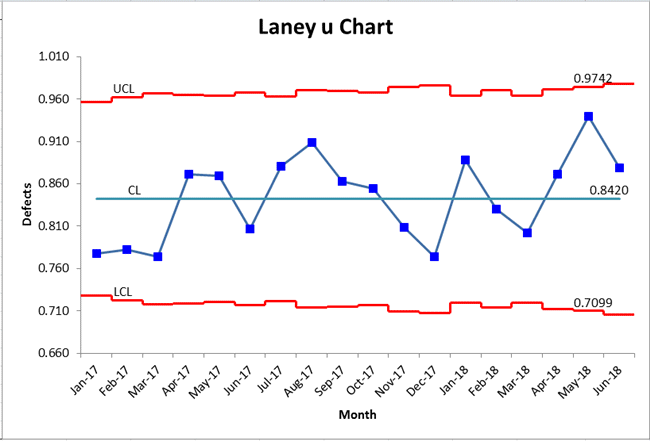
Laney u' chart on the same data
A Laney u' Chart will have wider control limits than the u Chart and it will have varying control limits that may help identify unstable points not identified by the XmR Chart. Here is a Laney u' Chart of the same data.
Toggle Between u Chart and u' Chart:
Specifically offered in the u Chart macro, you can toggle between a u Chart and a u' Chart by inputting either "False" (u Chart) or "True" (u' Chart). This option is located to the right of your chart:
![]()
Laney u' Chart Ready Made Template
QI Macros also contains a Laney u' Chart template. Open it by clicking QI Macros > Control Chart Templates > Attribute > u Chart to open up the u Chart template. Then click on the u' Chart Skyline tab at the bottom to open up the Laney u' Chart (p Prime) template.
Stop Struggling with Laney u' Charts!
Start creating your Laney u' Charts in just minutes.
Download a free 30-day trial. Get Laney u' Charts now!
QI Macros Draws These Charts Too!
