Struggling to Understand Control Chart Rules?
QI Macros add-in for Excel will create control charts
in seconds
and analyze stability so that you don't have to!
To Analyze Stability using Control Chart Rules:
- Create a control chart from QI Macros menu.
- QI Macros will do the math, draw the graph and analyze stability for you.
Why it Matters:
- a process must be stable before you can analyze process capability to determine if it meets customer specifications.
- a process must be stable before beginning an improvement project.
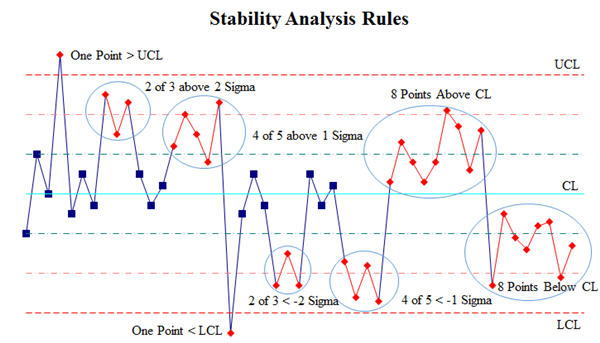
How does a control chart help determine if a process is out of control?
- Control limits (±1, 2, 3 sigma) are calculated from the data.
- Zones represent the spaces between the limits.
- Control chart rules are then applied to data points as they move through those zones.
- Unstable points and trends are identified for investigation.

QI Macros highlights unstable points and trends by turning them red.

Control Chart Rules used by various industries and experts
Control chart rules can vary slightly by industry. However, most of the basic rules used to run stability analysis are the same.
QI Macros uses the rules from Introduction to Statistical Process Control, 4th edition pp 172-175, Montgomery as its default. QI Macros also offers these other rules and makes it easy to change from one rule set to another using its Control Chart Rules sub-menu.
| # | Control Chart Rule |
Westgard | Nelson-Juran | AIAG | Montgomery | Western Electric | IHI |
|---|---|---|---|---|---|---|---|
| 1 | n points above UCL or below LCL |
1 | 1 | 1 | 1 | 1 | 1 |
| 2 | Zone A: n of n+1 points above/below 2 sigma
|
2 | 2 | 2 | 2 | 2 | 2 |
| 3 | Zone B: n of n+1 points above/below 1 sigma |
4 | 4 | 4 | 4 | ||
| 4 | n points in a row above/ below center line |
8 | 9 | 7 | 8 | 8 | 8 |
| 5 | Trends of n points in a row increasing or decreasing |
7 | 6 | 6 | 6 | 6 | |
| 6 | Zone C: n points in a row inside Zone C (hugging) |
15 | 15 | 15 | 15 | ||
| 7 | n points in a row alternating up and down |
14 | 14 | 14 | |||
| 8 | Zone C:n points in a row outside Zone C |
8 | 8 | 8 | |||
| 9 | Zone B: 4 points above/ below 1 sigma; 2 points one above, one below 2 sigma |
4 |
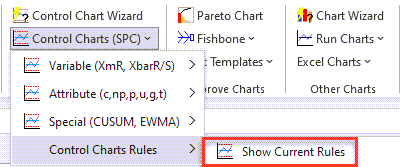
To view the Control Chart Rules that are currently enabled, select "Show Current Rules" from the Control Charts (SPC) > Control Charts Rules menu:
The Evolution of Control Chart Rules
Western Electric Rules were first developed almost 100 years ago.
Nelson Rules expanded the set of rules to cover increasingly rare conditions.

- Westgard Rules are used with Levey Jennings Charts in laboratories. They are a slightly different subset of traditional rules with a couple of special rules.
- AIAG Rules are recommended by the Automotive Industry Action Group. They are only slightly different from Nelson/Juran Rules, using 9 instead of 8 for detecting runs.
- Healthcare Rules are recommended by the Institute for Healthcare Improvement. They only use rules 1, 2, 4, 5, and 6.
Stop Struggling with Control Charts!
Start creating your Control Charts in just minutes.
Download a free 30-day trial. Get Control Charts now!
QI Macros Draws These Charts Too!
