QI Macros - the All in One Tool for Quality Professionals
SPC Charts - Lean Six Sigma Templates - Statistics - Data Mining
I’ve been using your QI Macros for the last ten years and have always found them the best and lowest cost tool available. The other “stat” and charting programs are way too expensive and complex for most of the QA people that I’ve trained.
- Steve Hoyt
ASQ Program Chair
QI Macros Add-In for Excel Installs a New Menu on Excel's Tool bar
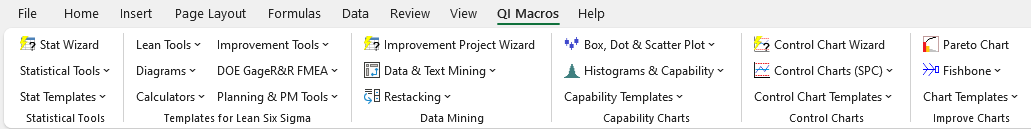
From the QI Macros menu you can access the following: 40 charts, 140 fill-in-the-blank-templates, 30 statistical tests, and powerful data mining tools.
These Key Tools are the Most Popular With Our Customers
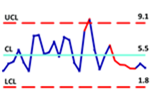
Control Charts
QI Macros includes all attribute control charts (p,np, c, u) and variable control charts (Individuals, XbarR, XandS). It also includes specialized control charts like Levey Jennings, Cusum, EMMA and more. Our control charts turn unstable points and trend red. Tasks like adding data, recalculating and splitting control limits are automated too.
If you are not sure which control chart to run, our control chart wizard will analyze your data and select the right control chart for you.
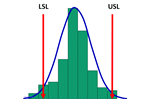
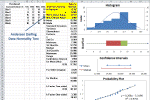
Histograms with Cp and Cpk
QI Macros creates histograms, frequency histograms and Weibull histograms for non-normal data. All histograms calculate process capability metrics like Cp, Cpk and Pp Ppk. Histograms will prompt you for your specification limits and use them for these calculations. Specification limits are drawn on the histogram along with a bell curve.
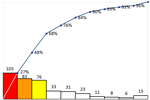
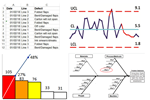
Pareto Charts
QI Macros creates the best looking Pareto chart on the market. Our Paretos contain: a cumulative line graph with %, no space between bars, and an "Other" bar for miscellaneous categories. Bars greater than 20% are shaded for easy identification.
QI Macros allows you to choose the number of bars you want before summarizing into an Other bar. You can also create several Pareto charts at once and create charts from raw data that has not been sub-totaled.
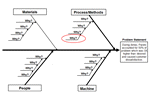
Automated Fishbone Diagram
Fishbones are a critical part of any improvement effort. However, they can be a pain to create.
Not anymore! QI Macros can create a fishbone diagram in seconds. Just type your root causes into a preformatted matrix, then click a button and QI Macros draws the fishbone for you. It also contains buttons for copying your diagram into Word or PowerPoint.
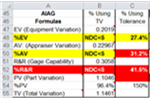
Gage R&R Templates
QI Macros contains fill-in-the-blank Gage R&R templates for up to nine types of Gage R&R studies. Our templates perform all of the calculations AND help you interpret the results. QI Macros templates are compatible with the latest AIAG Measurement Systems Analysis manual (MSA, 4th edition).
Data Mining Tools
Customers tell us half the battle of meaningful data analysis is to get their data in a usable format. QI Macros contains tools to help you stack and unstack data columns. More importantly, QI Macros contains one-click wizards which can create PivotTables and count words in text files.
Our Improvement Project Wizard will analyze an entire table of data and create: PivotTables, control charts, Pareto charts and even populate the problem statement for a fishbone diagram. You won't believe it until you see it.
Statistical Analysis Tools
Most people are intimidated by math and statistics. Hypothesis testing is like a foreign language that no one (except statisticians) understands. The good news is that you don't have to be a statistician to use QI Macros.
The QI Macros Stat Wizard will analyze your data and select the right statistical tests for you. QI Macros statistical tests perform all of the calculations for you AND will interpret the results for you in plain English.
QI Macros is long on Six Sigma capabilities, with some Lean tools and techniques built in as well... Chances are many Green Belts and some Black Belts will be able to do everything they need with QI Macros and Excel...
The familiar Excel interface reduces the learning curve and makes it a viable option for anyone who needs to create control charts, conduct statistical analysis or perform data manipulations.Heidi Wiesenfelder, Bright Hub
Join 100,000+ Users
in 80 Countries


KnowWare International, Inc.
2696 S. Colorado Blvd., Ste. 555
Denver, CO 80222 USA
Toll-Free: 1-888-468-1537
Local: (303) 756-9144