Not sure how to do Gage R&R - Measurement System Analysis?
QI Macros can help, even if you don't know ANYTHING about GR&R!
QI Macros Gage R&R Template
- Click on QI Macros menu > DOE Gage R&R > Gage R&R.
- Conduct your Gage R&R Study and enter the measurements in the template.
- Analyze results
Why Does It Matter?
Measurement can be a significant cause of error. Ensuring that your measurement system is capable of accurately measuring your product is a great first step toward quality control.
Go Deeper: When you perform a Gage R&R Study, three factors come into play:

Part Variation
Difference between individual parts

Equipment Variation (Repeatability)
Can one person, using the same gage, measure the same part consistently?

Appraiser Variation (Reproducibility)
Can two people using the same gage, measure the same part consistently?
You want most of the variation to be between the parts, and less than 10% of the variation to be caused by the measurement system (the appraisers and the equipment.) Makes sense, doesn't it?
If the appraiser can't get the same measurement twice, or two appraisers can't get the same measurement, then your measurement system becomes a key source of error.
Use MSA to evaluate your measurement system - NOT your parts.
You need bad parts to perform a good Gage R&R Study.
- Jay Arthur, Lean Six Sigma Demystified
To Conduct a Gage R&R Study, You Will Need:
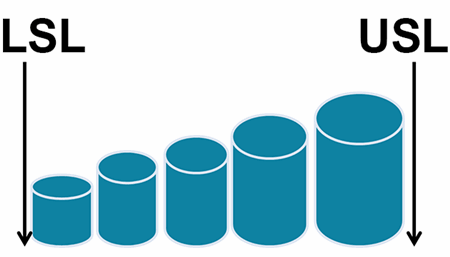
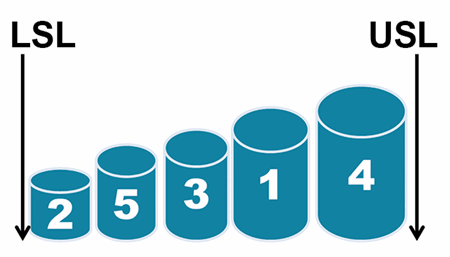
- Five to ten parts that span the distance between the upper and lower spec limits.
The parts should represent the actual or expected range of process variation. Number each part for the study but don't put them in any kind of order. Rule of thumb: if you're measuring to 0.0001, the range of parts should be 10 times the resolution (e.g., 0.4995 to 0.5005). - Two to three appraisers (people who measure the parts)
- One measurement tool or gage
- Software to perform the calculations, like QI Macros Gage R&R template for Excel.
Note: If you do not have enough part variation, you cannot get a good Gage R&R.
Gage R&R Steps to Follow
-
Number the parts in random order, not in order of size.
- Have each appraiser measure each part two or three times.
- Input the measurements into QI Macros Gage R&R template or some other software.
-
Check the Number of Distinct Categories (NDC) calculation in cell F52 of QI Macros template.
- Is NDC greater than five? If yes, continue.
- If NDC is less than 5, you need more part variation. You will need to start over and get parts that span the specification tolerance.
Interpreting the Results
You will want most of the variation to be between the parts, and less than 10% to be caused by the measurement system (appraisers and equipment).
Gage R&R System Acceptability
- % R&R<10% - Gage System Okay
(Most variation caused by parts, not people or equipment) - % R&R<30% - May be acceptable based on importance of application and cost of gage or repair
- % R&R>30% - Gage system needs improvement
(People and equipment cause over one-third of the variation)
What To Look For
Equipment Variation - % EV (Repeatability)
If repeatability (Equipment variation) is larger than reproducibility (appraiser variation), reasons include:
- Gage needs maintenance (gages can get corroded)
- Gage needs to be redesigned to be used more accurately
- Clamping of the part or gage, or where it's measured needs to be improved (imagine measuring a baseball bat at various places along the tapered contour; you'll get different results).
- Excessive within-part variation (Imagine a steel rod that's bigger at one end than the other. If you measure different ends each time, you'll get widely varying results).
Appraiser Variation - % AV (Reproducibility)
If reproducibility (appraiser variation) is larger than repeatability (equipment variation), reasons include:
- Operators need to be better trained in a consistent method for using and reading the gage
- Calibrations on gage are unclear
- Fixture required to help the operator use gage more consistently
Data Examples
| One Appraiser - Two Parts | Part 1 |
Part 2 |
| No Equipment Variation | 0.65, 0.65 |
0.66, 0.66 |
| Equipment Variation | 0.65, 0.67 |
0.67, 0.65 |
| Two Appraisers - One Part | Appraiser 1 |
Appraiser 2 |
| No Appraiser Variation | 0.65, 0.65 |
0.65, 0.65 |
| Appraiser Variation | 0.65, 0.65 |
0.66, 0.66 |
When to Use With Interaction and Without Interaction
If your p value in Appraiser x Part < 0.05 (or your Alpha), use With Interaction
If your p value in Appraiser x Part > 0.05 (or your Alpha), use Without Interaction
Common Mistakes People Make
Many people call us because they don't like the answer they get using the Gage R&R template. Most of the time, it's because they didn't follow the instructions for conducting the study. Here are some of the common mistakes I've seen:
- Forgetting that the Gage R&R study is evaluating their measurement system and NOT their products. Gage R&R does not care about how good your products are. It only cares about how good you measure your products.
- Using only one part. If you only use one part, THERE CAN'T BE ANY PART VARIATION, so people and equipment are the ONLY source of variation.
- Using the one part measurement for all 10 parts (again, there won't be any part variation, so it all falls on the people and equipment).
- Using too many trials (if you use five trials, you have more opportunity for equipment variation).
- Using too many appraisers (if you use all three, you have more opportunity for appraiser variation).
- Using fake data. Try using the AIAG SPC data the QI Macros loads on your computer at C:\Program Files\QIMacros\TestData.
- Using a gage that measures in too much detail. If your part is 74mm +/- 0.05, then you don’t need a gage that measures to ten thousandths of an inch (0.0001) you only need one that measures to the hundredth of an inch (0.01).
"Using a measurement increment that is too large will throw away useful information. Using a measurement increment that is too small will add noise to your measurements."
- Donald J. Wheeler
Challenges You Will Face
One customer faced an unusual challenge: they were producing parts so precisely that there was little or no part variation even when measured down to 1/10,000th of an inch. Their existing gages ceased to detect any variation from part to part.
As your process improves and your product approaches the ideal target measurement, you'll have less part variation and more chance for your equipment or people to become the major source of variation. As your product and your process improve, your measurement system will need to improve as well.
Conclusion
Your goal is to minimize the amount of variation and error introduced by measurement, so that you can focus on part variation. This, of course, leads you back into the other root causes of variation: process, machines, and materials.
If you manufacture anything, measurement system analysis can help you improve the quality of your products, get more business from big customers, and baffle your competition. Enjoy.
You don't have to be an expert.
Use QI Macros Gage R&R template to mistake-proof your calculations.
Download a free 30-day trial. Get the Gage R&R template now!
QI Macros Draws These Charts Too!
