Looking for a Gage R&R Bias & Linearity Excel Template?
QI Macros has a ready made Bias & Linearity template for you!
Bias and Linearity are Two Key Factors in Measurement Systems Analysis
Bias: Does your gage tend to over read or under read the same size part?
(Imagine measuring the length or diameter of a steel rod with known dimensions.)
Linearity: Does your gage over read or under read across a range of different sized parts?
(Imagine using the gage on tin cans of various diameters, from small, 6 oz. juice cans to 64 oz., family-sized cans.)
Gage R&R Bias Study Using the QI Macros Bias Template
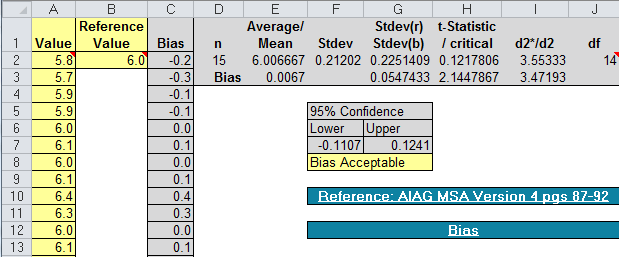
If you want to know the "bias" of your gage, simply input the "target" or "reference" value for the parts being measured into B2 and your measurements into column A. QI Macros Gage R&R template, will calculate the bias of the gage (plus or minus).

Linearity Study Using the QI Macros Linearity Template
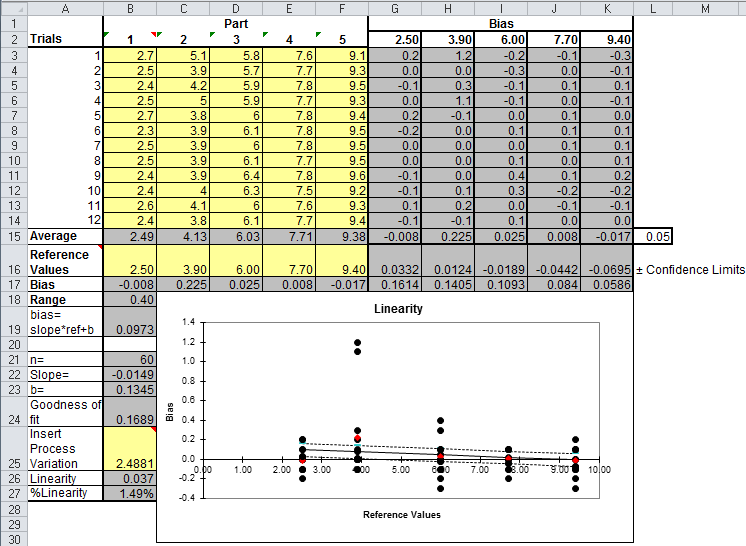
To conduct a linearity study, you will need five parts of DIFFERENT sizes that have been accurately measured.
- Have each of the five parts measured 12 times.
- Input the data into the QI Macros Gage R&R Linearity template.
(Columns B through F) - Input the accurate measurements for each part as Reference Values in row 16.
- Input your Process Variation or Tolerance in row 25.
(If you don't have a tolerance, leave this value be, as it was automatically calculated based off your data) - Analyze the linearity using the line graph on the worksheet:

Ideally, there shouldn't be any change in bias from small to large. If you look at the line graph, it should be a horizontal line. More often, however, a gage may over read the small and under read the large.
If there is too much slope to the line (too much bias), you may want to use the gage in its optimal range and find other gages to measure where this gage's bias is too large.
Summary
So, there, in a nutshell Bias and Linearity. Your goal is to minimize the amount of variation and error introduced by measurement, so that you can focus on part variation. This, of course, leads you back into the other root causes of variation: process, machines, and materials.
If you manufacture anything, measurement system analysis can help you improve the quality of your products, get more business from big customers, and baffle your competition. Enjoy!
Linearity Study Example Video Tutorial
You don't have to be an expert.
Use QI Macros Gage R&R template to mistake-proof your calculations.
Download a free 30-day trial. Get the Gage R&R template now!
QI Macros Draws These Charts Too!

