Looking for an Attribute Gage R&R Template in Excel?
QI Macros has a ready made Attribute Gage R&R template for you!
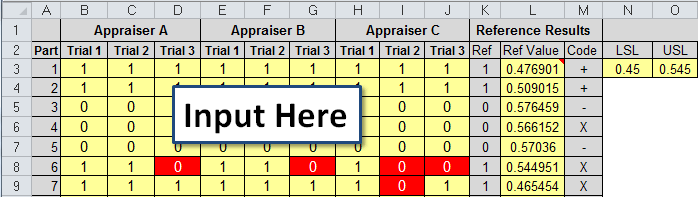
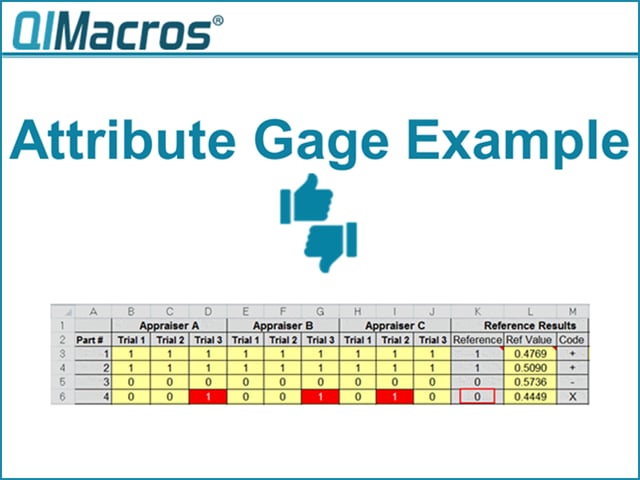
Example of QI Macros template which is compatible with AIAG MSA 4th edition.
When to Perform an Attribute Gage R&R Study:
- Perform an Attribute Gage R&R Study when the measurement value has a limited number of possibilities.
- This differs from a variables measurement system when you can have any number of possible results.
- The most common example is a go/no go, pass/fail, gage that only provides two results.
Attribute Agreement Analysis
In instances where there is no objective measurement device like a gage, follow these procedures to conduct an attribute agreement analysis.
Step by Step Instructions for Using QI Macros Attribute Gage R&R Template
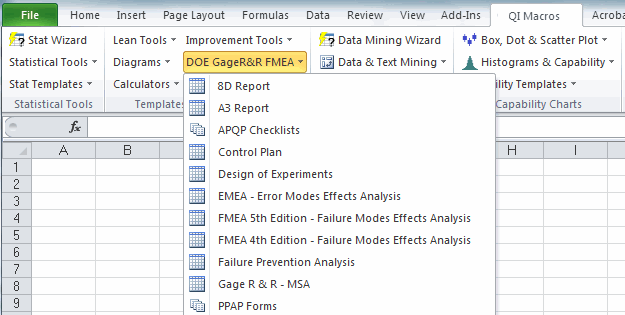
- Open the template by clicking on QI Macros menu > DOE Gage R&R FMEA > Gage R&R.
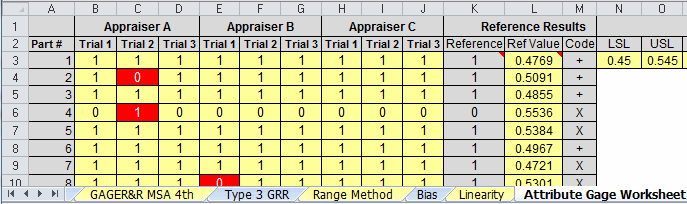
- Click on the Attribute Gage Worksheet to open the Attribute Gage Study Template.
- Input the Upper and Lower Spec Limits in cells N3:O3 if you actually have reference data in column L.
This calculates the reference criteria in column K.
Note: If your attributes themselves are binary qualities that are non-numerical (e.g. opaque/clear, etc.) you will: - Change the values in column K to be 1 (pass) or 0 (fail), as determined by an experienced appraiser.
- Clear the values in N3:O3 and leave those cells blank,
- Clear the values in column L and leave those cells blank,
- Select 10 parts and measure them accurately using a variable gage to get a reference value for each. Enter the reference values in column L.
- The template will calculate if the reference value in column L is within the spec limits. If the value is within the spec limits, the corresponding cell in column K will be populated with a 1 (Pass). If the reference value is outside of the spec limits then K will be populated with 0 (Fail).
If you do not have reference values to input in L, then input the reference for each part directly into K (1 for Pass and 0 for Fail).
Tip: The 10 parts must have an actual reference value spanning unacceptable low to unacceptable high.
- Have 3 appraisers use the attribute gage to accept/reject 10+ parts with at least three trials.
- Enter pass/fail in columns B-J. 1 = pass (the value is between the spec limits) and 0 = Fail (value is outside of the spec limits). If the appraisers result differs from the reference result in column K, then the cell will be highlighted in red.
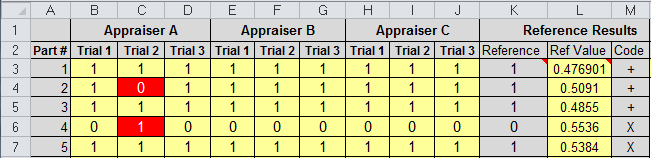
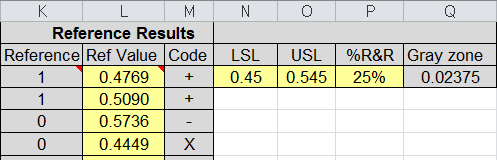
Explanation of Code (column M): This section indicates whether your Reference Value is within your Spec Limits (+) or outside of your Spec Limits (-). If you receive an (X), this means your Reference Value falls within the "Gray Zone."
%R&R: This is the calculated value that is provided after you have run a Gage R&R Study
(NOTE: Value is provided upon completion of a Gage R&R MSA 4th, Gage R&R 30 Parts, or Type 3 Gage R&R Study).
Under 10%: Your measurement system is generally considered to be acceptable.
10%-29.9%: Your measurement system MAY be thought of as acceptable.
30% or Greater: Your measurement system is NOT considered acceptable.
Gray Zone: This value is informed by the %R&R value and provides you with the "zone" (above or below your spec limits) of where "Bad Parts" can potentially be mistaken as "Good Parts" and vice versa.
The above example's Gray Zone would be any Ref Value between 0.42625 and 0.450 (LSL - Gray Zone), along with 0.545 and 0.56875 (USL + Gray Zone).
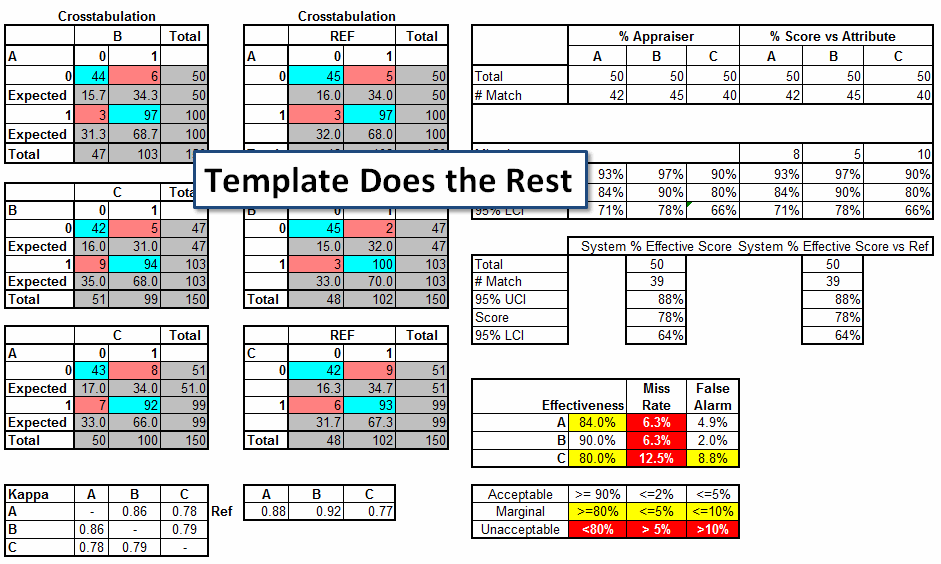
How to Evaluate the Results Calculated by the Attribute Gage R&R Template
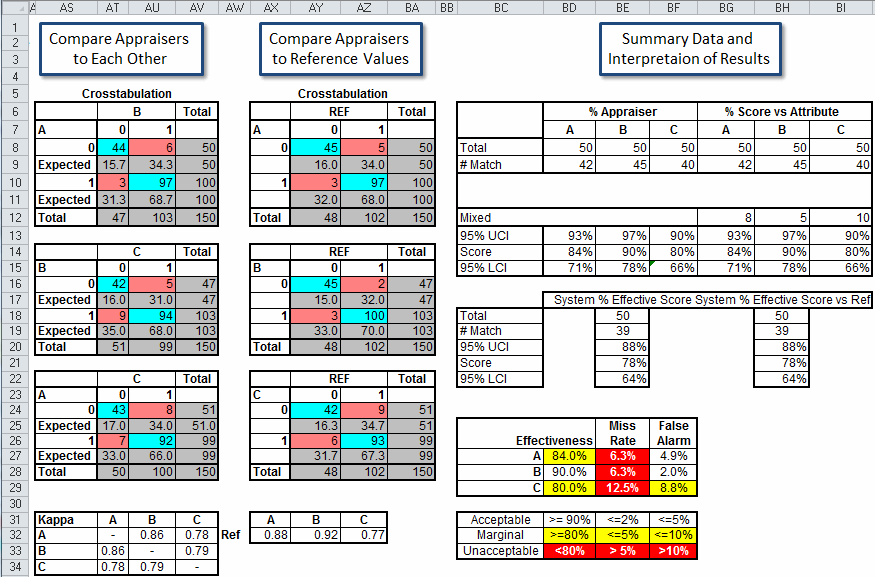
Kappa: The value used to compare two appraisers measuring the same parts:
Kappa (maximum of 1) > 0.75 = Good to Excellent agreement
0.40 < (minimum of -1) = Poor agreement
UCI: Upper Confidence Interval
LCI: Lower Confidence Interval
Fleiss' Kappa Statistics Output Provided in the Attribute Gage R&R Template
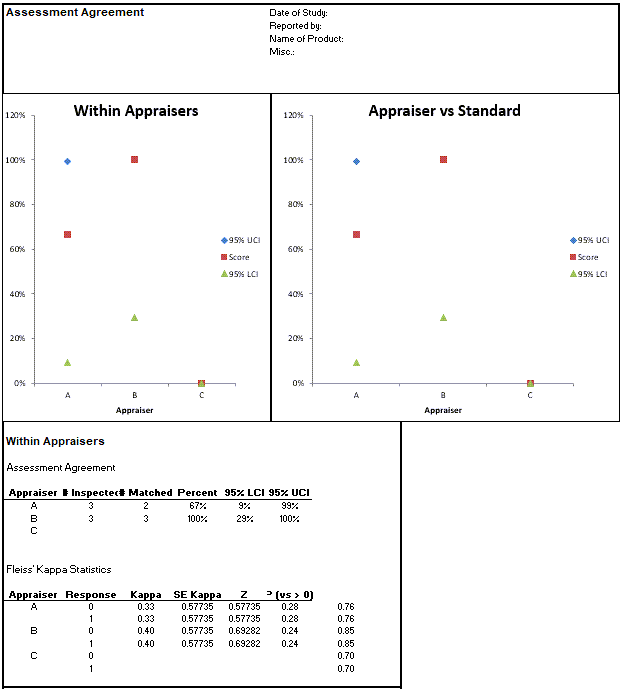
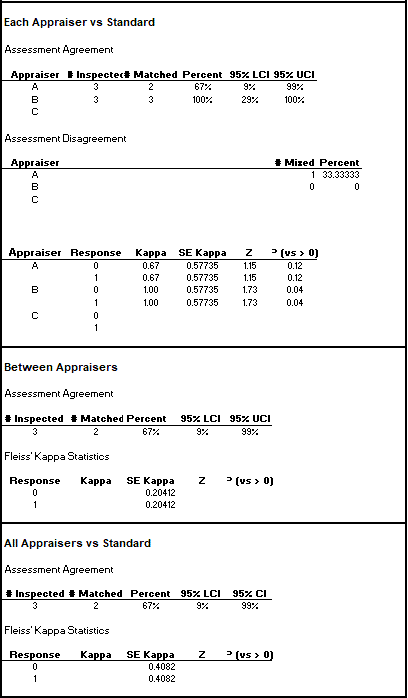
NOTE: Fleiss' Kappa Statistics output was included in the July 2025 version of QI Macros.
Attribute Gage R&R Video Tutorial
You don't have to be an expert.
Use QI Macros Attribute Gage R&R template to mistake-proof your calculations.
Download a free 30-day trial. Get the Attribute Gage R&R template now!
QI Macros Draws These Charts Too!
