Not Sure How to do Gage R&R Destructive Testing
QI Macros can help!
What can you do when each piece is destroyed when measured during a Gage R&R study? What if you conduct an impact or other test that makes it impossible to measure repeatedly? Let's look at using an XmR chart.
In this example, there were 10 testers destructively testing 10 samples each from the same production lot. The lower specification limit is 16.7 foot pounds/sq. in.
Using QI Macros SPC Software for Excel, we can put a blank row between each of the 10 testers data and run the XmR chart.

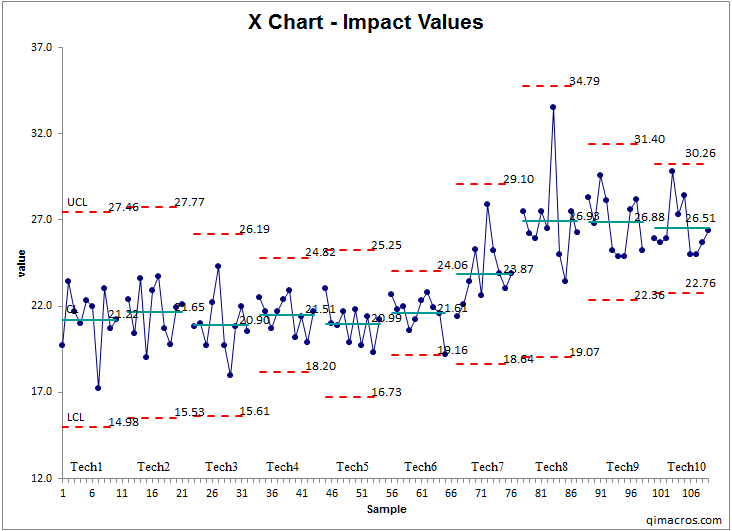
Analysis of the Individuals Moving Range (X Chart)
If all 10 are using the same process to measure samples from a well-known and established process, then we'd expect the averages to be the same and the variation represented by the UCL and LCL to be equal.
If the averages or standard deviations are different from appraiser to appraiser (i.e., tech to tech), then the measurement system needs improvement.
Look at the X chart. Six of the ten share roughly the same average and Techs 8, 9, and 10 share a different average. If they are all measuring samples from the same lot, then they must be using two different measurement processes. Tech 6 is between the other two groups. Which of the two main groups are measuring correctly? How can you train the others to match?
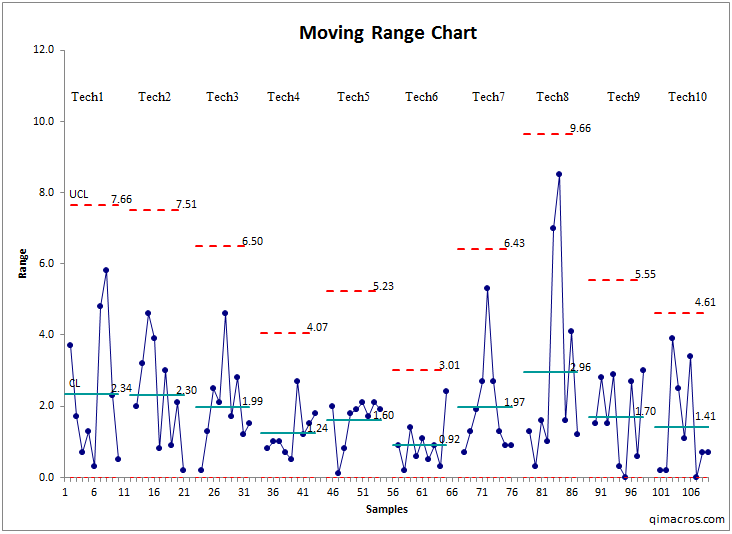
Analysis of the Moving Range Chart
Look at the X chart and the Range chart to evaluate the variation (another key factor in Gage R&R).
Technicians 4, 6, and 10 have the least variation. What are they doing that produces more consistent results? How can you train the others to match the consistency?
Ideally, all of the appraisers should get close to the same average and standard deviation. Adjust the measurement process until you get the UCL, LCL, and CL to line up more closely.
Stop Struggling with Control charts!
Start creating your Control charts in just minutes.
Download a free 30-day trial. Get Control charts now!
QI Macros Draws These Charts Too!

