Struggling to Start a Quality Improvement Project?
QI Macros can help by analyzing your data and creating charts with one click!
Create Improvement Projects in Seconds Using This Revolutionary New AI Improvement Project Wizard Tool for Excel
Is This Cheating?
How do you succeed in project after project with 100% success rate? Take out the guesswork!
Over the years, I've helped companies save millions of dollars by analyzing data from all kinds of systems—payroll, accounting, service orders, CRM and many more. The secret has always been to analyze the data using Excel PivotTables to summarize the data and then turn those summaries into control charts and Pareto charts.
I finally realized that I shouldn't waste people's time teaching them how to do this if I can make Excel do it for them. That's why I have added a Improvement Project Wizard to QI Macros Add in for Excel. It automates the creation of a PivotTable and all of the charts that can be derived from the data. That's right! It will examine your data, summarize it and create control charts and Pareto charts automatically!
Here's How the AI Improvement Project Wizard Works
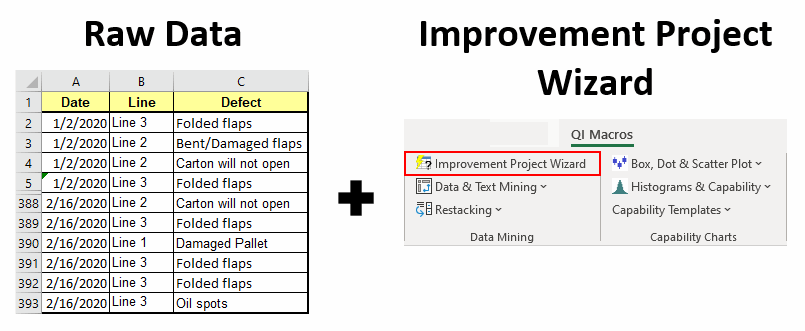
Improvement Project Wizard Input

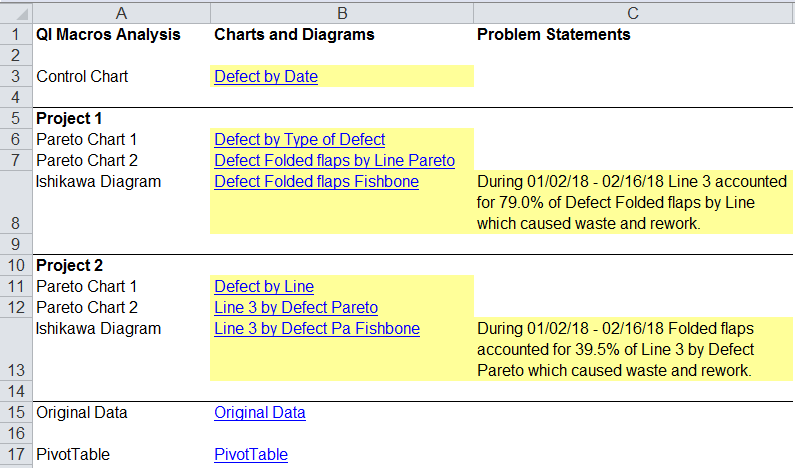
AI Improvement Project Wizard Output
- Data Analysis summary report listing the charts that were created and the problem statements to be considered:

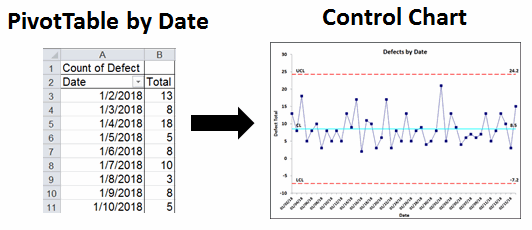
- PivotTable by date and control chart over time

- PivotTables by category with associated Pareto charts and problem statements identified by analyzing the big bars on the Paretos.

There are people in the Excel and Six Sigma communities that will think this is cheating! That it's too easy. So what? Ignore them and start creating million-dollar improvement projects.
What are Customers saying about our Improvement Project Wizard?
"I was very well impressed with the functionality of QI Macros Data Mining Wizard (now known as Improvement Project Wizard). This certainly saves time and cuts down the chart populating process substantially. I will be recommending this tool to my colleagues here at work and within the ASQ leadership community."
- Jerrod Higgins
Quality Engineer
Fine Tuning Results
One common problem is having too many columns which can lead to lots of charts.
Or there can be columns that aren't related to the problem.
Reduce the number of columns to:
- When - Column of dates or times
- Where - Column of locations (e.g., machine, nursing unit, work unit, etc.)
- What - Column of type of defect, mistake or error
- How much - Column of cost in dollars, scrap, patient harm or whatever
- Who - Column of suppliers, customers, work groups involved in the issue
The example above has columns for When, Where and What.
Why Choose QI Macros Data Mining Software?
Are You New to Data Mining or Six Sigma?
QI Macros Eliminates the Learning Curve!
If you've got raw data about defects, but don't know what to do with it, the Improvement Project Wizard will do it for you.
I've taken 25 years of hard won data analysis and Six Sigma experience and coded it into the software. The Improvement Project Wizard will create control charts, Pareto charts and Fishbone diagrams from your data.
Are You Already Using Excel to Mine Data?
QI Macros will accelerate your results.
I used to spend hours and sometimes days creating PivotTables and charts. Now I can do it with one click of a button.
I spend my time analyzing the results and making improvements, not figuring out what to do with the data.
Is Most of Your Data Already in Excel?
QI Macros Works Inside Microsoft Excel
You don't need to learn a separate software application to create Six Sigma projects. And whatever you create can be shared with anyone who has Excel!
QI Macros is compatible with Excel 2013-2021/Office 365 (PC) | 2019-2021/Office 365 (Mac)
Learn more with a step by step example
Stop Struggling with Improvement Projects!
Start creating your Improvement Projects in just minutes.
Download a free 30-day trial. Get Improvement Projects now!
QI Macros Draws These Charts Too!

