Struggling with How to Analyze Your Data in Excel?
QI Macros has easy to use data mining tools to help!
Customers tell us that half the battle is figuring out what to do with their data.
- Do you struggle with Excel's Pivot Table function?
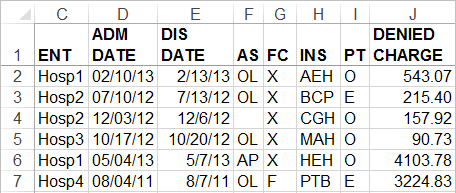
- Is your data buried in flat transaction files or text files like the ones below?
- Do you struggle to turn this kind of data into actionable improvement stories?
Structured Data Exported from Tracking Systems

QI Macros Improvement Project Wizard Results

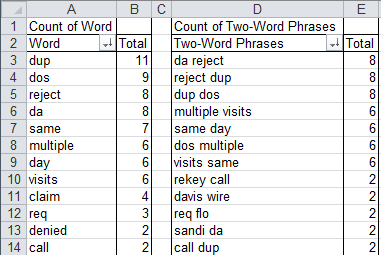
Unstructured Data Exported from Tracking Systems

QI Macros Word Count Wizard Results

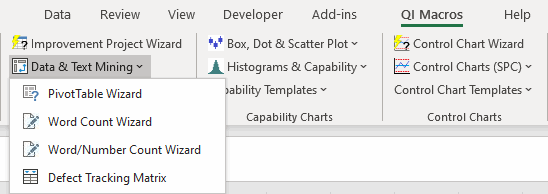
QI Macros Data Mining Tools can be accessed on a tab we add to Excel's menu:
Excel 2013-2021, Office 365:
You'll Find These Easy to Use Data Mining Tools in QI Macros
Analyzes an tables of defect data using PivotTables to create Improvement Projects with control charts, Pareto charts and Fishbones.
Creates all of the charts necessary to develop a rock-solid, bullet-proof business case for change.
Excel Pivot tables can be hard to learn but they are a snap with QI Macros. Just select up to four columns of data and then click on QI Macros PivotTable Wizard to create a PivotTable in seconds.
There are million dollar improvement projects lurking in your data. Don't miss out on these huge opportunities.
Counts the number of times a word or two-word phrase or number appears in text/number data. Use it to analyze employee feedback, call center notes, customer reviews and more. Easily create Pareto charts, too!
Want to know what customers are peeved about? Use Word Count to find out!
Excel allows you to Paste Links to data or Transpose your data, but not both.. Use QI Macros to do both at the same time. QI Macros is also smart enough to prevent putting zeros instead of blanks in linked cells.
Use Paste Link / Transpose to link existing data to QI Macros Lean Six Sigma chart templates to simplify reporting.
View Data Mining Tools Tutorial - 14 minutes
QI Macros Draws These Charts Too!


