Struggling With Which Statistical Test to Run?
QI Macros Takes the Guesswork out of Selecting the Right Statistical Test!
No Other Software Can Do This!
Why Does It Matter?
People are often unsure about what statistics to use and in what order. The Stat Wizard automates those choices so that you can get on with analysis..
Go Deeper: QI Macros Statistical Wizard is Easy to Use
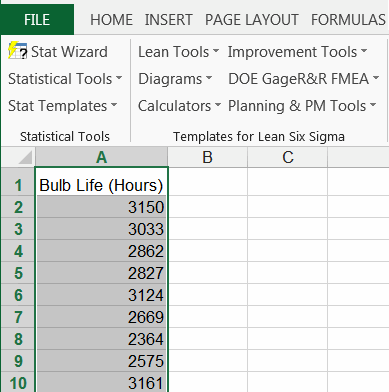
1. Just select your data
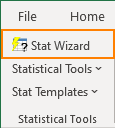
2. Select the Stat Wizard
3. QI Macros does the rest
Decision Trees are Cumbersome
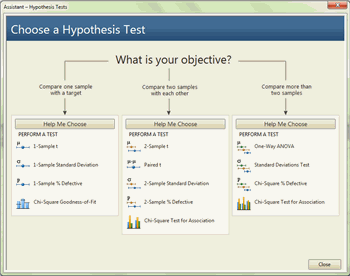
If you are like most people, you have a hard time deciding which statistical test to run. Rather than finding your way through a forest of decision trees, like the ones in Minitab®, QI Macros has built the decision tree right into its code!
Since you select your data first when you use QI Macros, it can choose the most likely statistical analysis tests and run them for you. Even better, QI Macros interprets the results for you too!
Use this
Not that
How the Statistics Wizard Selects the Right Tests to Run
The Stat Wizard will look at your data to determine if it has 1, 2 or more columns of data. Then, depending on the number of columns and whether the data has decimals or integers, it will run the following statistics:
1-Column Example
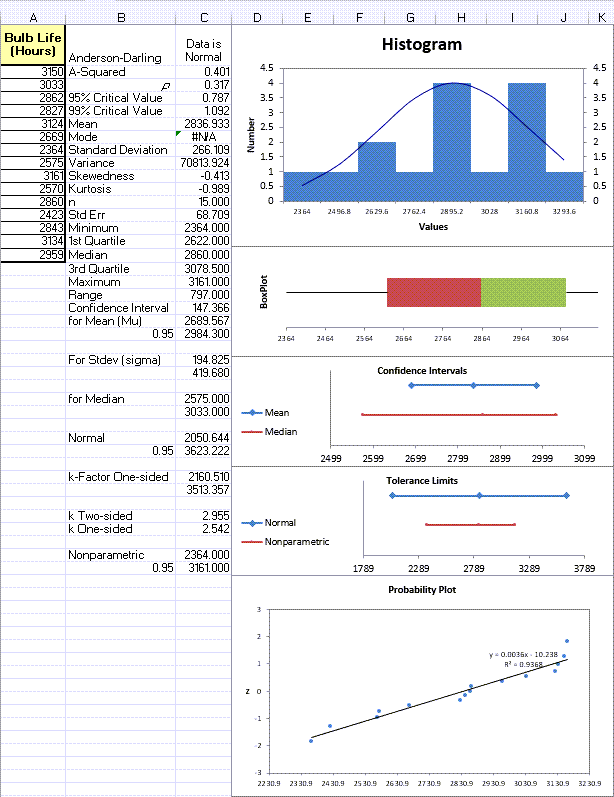
When you select one column of data, QI Macros Stat Wizard will run Descriptive Statistics and a 1-sample t Test:
Descriptive Statistics: Note p value is > 0.05 so data is normal.
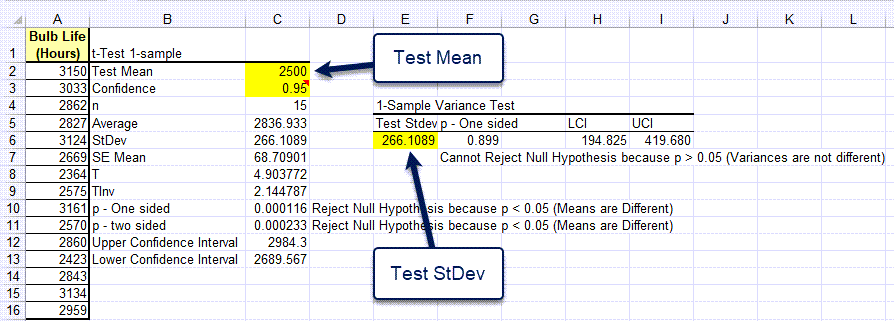
One Sample t Test: Using Test Mean of 2500 hours you will get:
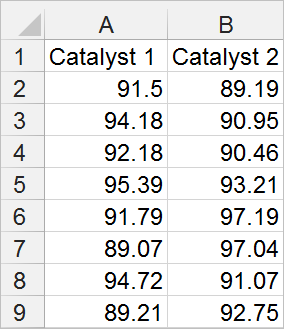
2-Column Example
By selecting two columns, the Stat Wizard will run an F Test, t Test, and an Equivalence Test (if Means are Equivalent). And if your data is integers, it will also run a Chi-Square Table for Independence.
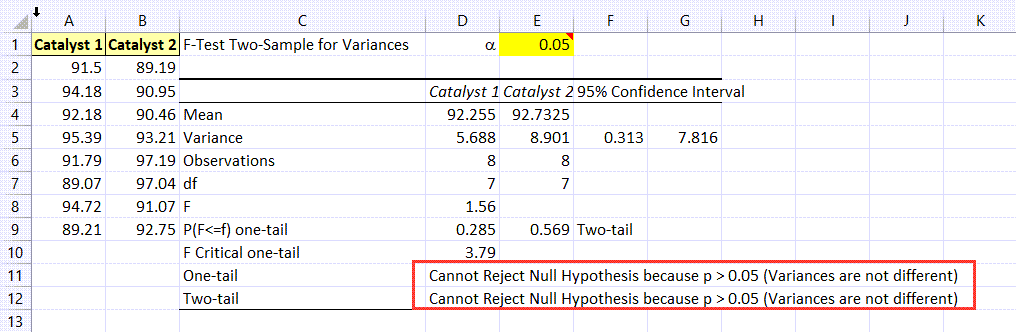
The Stat Wizard runs the F Test to evaluate variances:
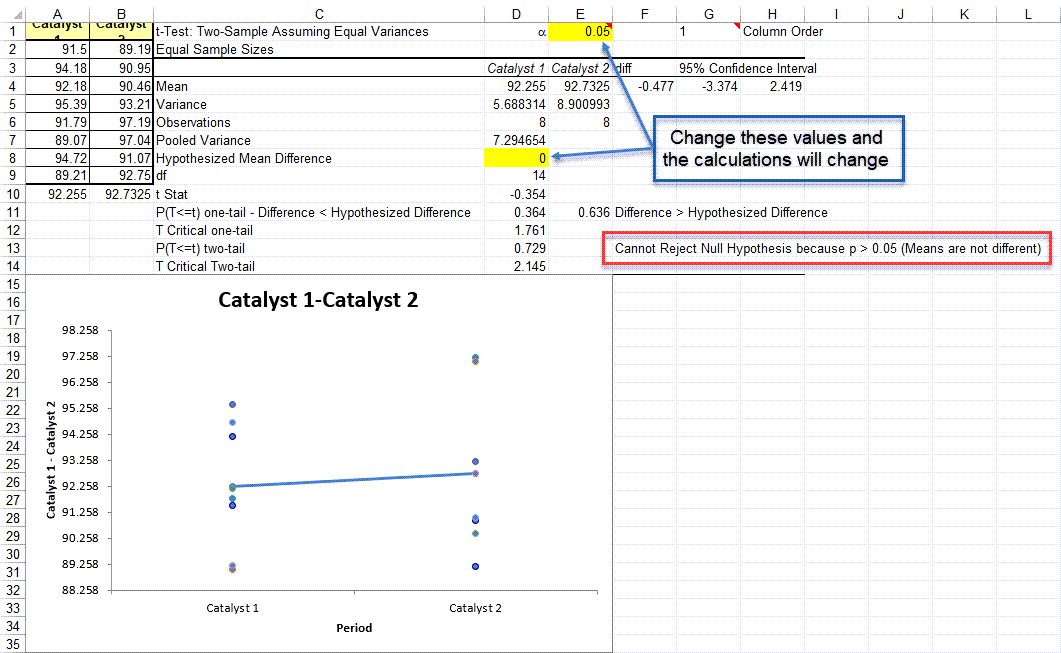
Since the F test assumes equal variances, the Stat Wizard runs a t Test assuming equal variances:
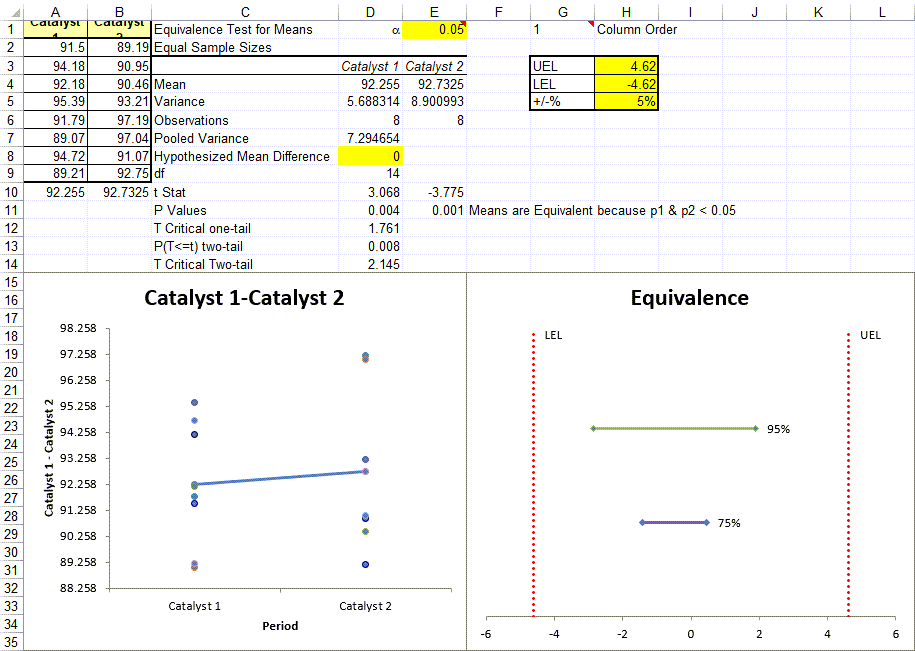
Next, it runs an Equivalence Test for Means (if Means are Equivalent):
It will then run a Chi-Squared Table, if your data is integers, to evaluate independence of the variables.
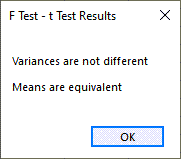
Finally, it reports a summary of the results:
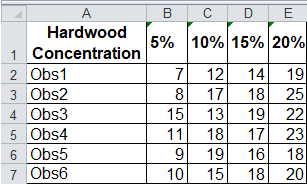
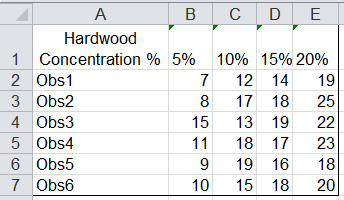
4-Column Example
By selecting the hardwood concentration data below, the Stat Wizard will run Descriptive Statistics, a one-way ANOVA to evaluate the means, an Equivalence Test (if Means are Equivalent), Levene's Test to evaluate the variances, and if your data is integers, a Chi-Squared table to evaluate independence of the variables.
First, select your data, click on the QI Macros menu and select "Stat Wizard":
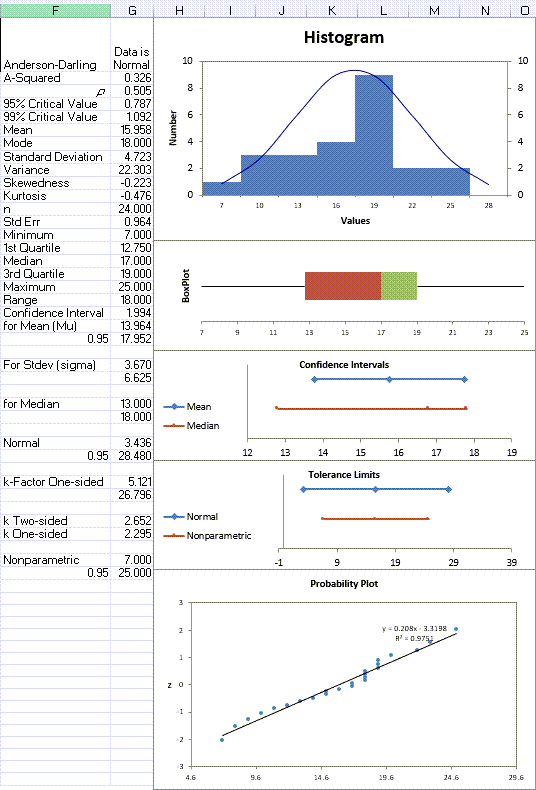
The Stat Wizard will run Descriptive Statistics on each column of data:
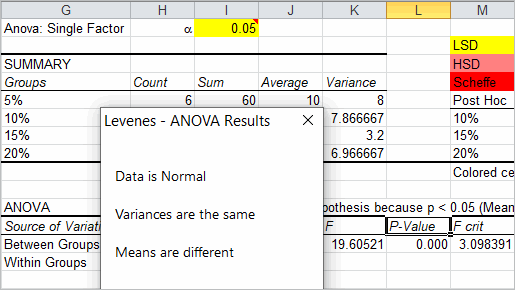
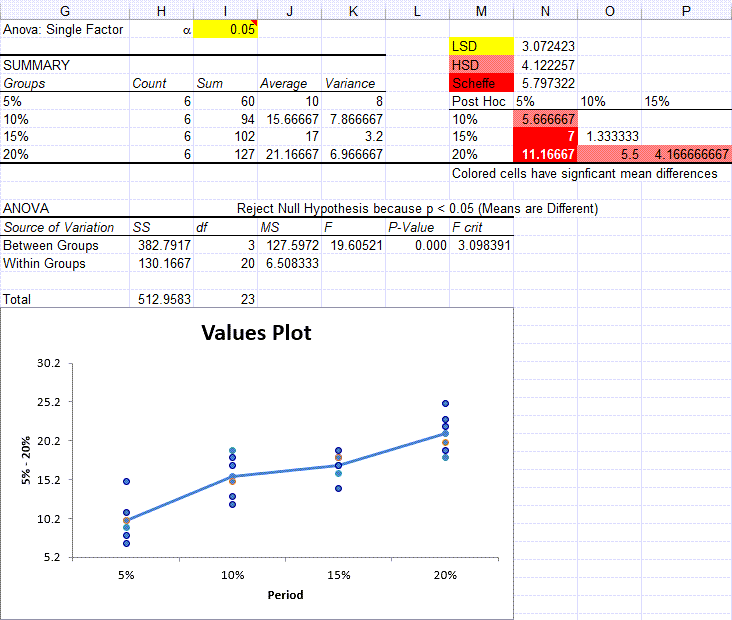
Next, it will create ANOVA Single Factor analysis:
Then, it will run an Equivalence Test (if Means are Equivalent).
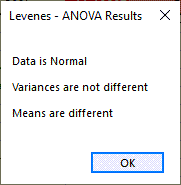
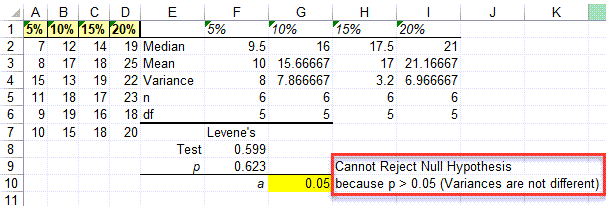
It will also run Levene's Test to evaluate Variances:
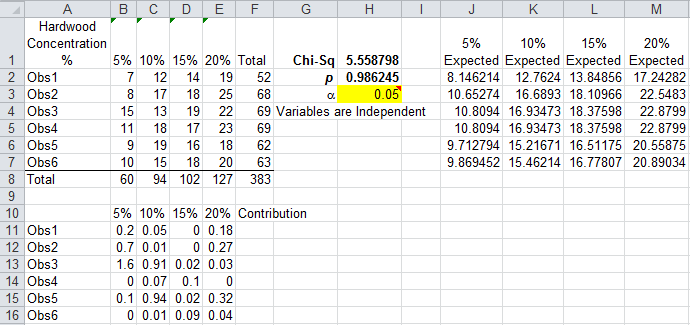
It will then run a Chi-Squared Table, if your data is integers, to evaluate independence of the variables:
Lastly, you will be provided with a report summary of the results:
Learn More...
- Statistical Tests run by QI Macros for Excel
- Non Parametric Tests
- List of all Wizards available in QI Macros
