Looking for a Tukey Quick Test Calculator in Excel?
QI Macros has a Ready-Made Tukey Test for You!
QI Macros add-in provides this functionality for you.
When to Use a Tukey Quick Test
A Tukey Quick Test is like a t-test, but it can handle nonparametric (i.e., non-normal) data. It helps determine if the means are the same or different from each other. The null hypothesis H0 is that the means are the same.
Tukey's Quick Test can be used when:
- There are two unpaired samples of similar size that overlap each other. Ratio of sizes should not exceed 4:3.
- One sample contains the highest value, the other sample contains the lowest value. One sample cannot contain both the highest and the lowest value, nor can both samples have the same high or low value.
By adding the counts of the number of unmatched points on either end, one can determine the 5%, 1% and 0.1% critical values as roughly 7, 10, and 13 points.
Tukey Quick Test Example Using QI Macros
This example uses the data from Tukey's original paper (A Quick, Compact, Two-Sample Test To Duckworth's Specifications, Technometrics, Vol. 1, No. 1, February, 1959):
To run a Tukey Test in QI Macros follow these steps:
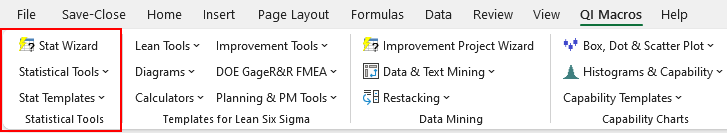
- Click on the QI Macros menu > Stat Templates > Tukey, then click on the Tukey Test tab.
- The Tukey Quick Test template will open with some pre-populated data in columns A and B. Just delete this data and enter your own. Note, that without data, D1:E1 show "Tukey Not Applicable." If the data violates any of the rules, the template will not calculate the Tukey Quick test:
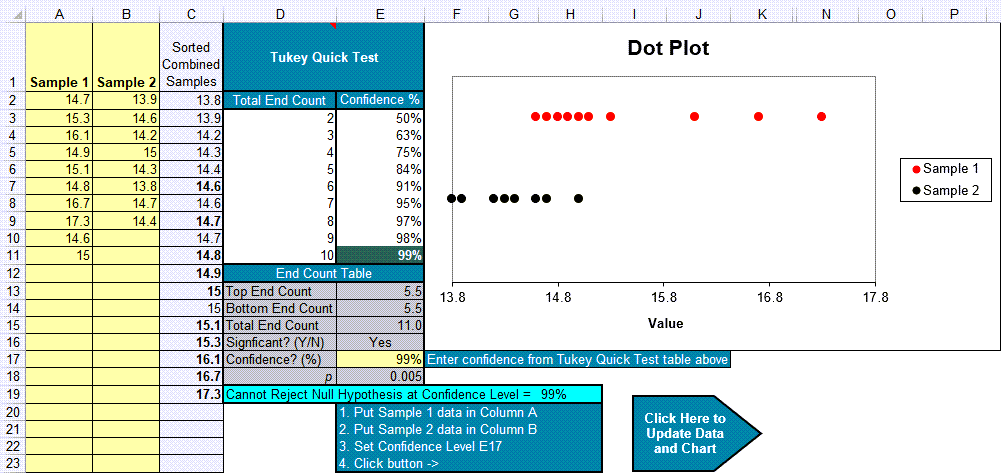
- Input your data in columns A and B and confidence level in cell E17 (default = 95).
- Next, click on the arrow in the lower right corner to Update column C and the Chart:

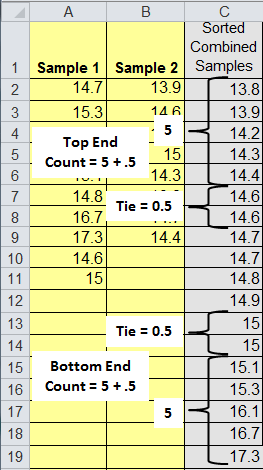
How End Counts (cells E13:15) are Determined
If we combine and sort the points from columns A and B, we can see that there are 5 unmatched points on either end (for a total of 10). And Tukey counts a tie (14.6 and 15.0) as 0.5. There are two of these for another count of 1. 10 + 1 equals a total of 11. This means that the two-sided confidence of 99% (>=10) applies:
Interpreting the Tukey Quick Test results
If |
Then |
| Total End Count >= 7 | Reject the null hypothesis at 5% confidence level. |
| Total End Count >= 10 | Reject the null hypothesis at 1% confidence level. |
| Total End Count >= 13 | Reject the null hypothesis at 0.1% confidence level. |
| Total End Count < 7 | Cannot Reject the null hypothesis (accept the null hypothesis) |
The null hypothesis H0 is that the means are the same. In this example, since the End Count = 11, we reject the null hypothesis at a 1% confidence level.
Haven't you waited long enough?
Start running Tukey quick tests in just minutes.
Download a free 30-day trial. Run Tukey quick tests on your data now!
Tukey quick tests are one of many statistical tests included in QI Macros add-in for Excel.
QI Macros adds a new tab to Excel's menu, making it easy to find any tool you need. You will find the statistical tools and templates on the far left side of QI Macros menu.