Struggling to Run a One Way ANOVA Test in Excel?
QI Macros can run Anova tests & interpret the results for you!
Run One-Way ANOVA using QI Macros
- Select your data.
- Click on QI Macros menu > Statistical Tools > ANOVA > ANOVA Single Factor
- QI Macros will do the math and analysis for you.
You Don't Have to be a Expert to Run a One-Way ANOVA test
- Does the thought of performing complicated statistical analysis intimidate you?
- Have you struggled with the awkward interface of Excel's Data Analysis Toolpak?
- Have you tried to learn another more complicated statistics program?
One-Way ANOVA Step-by-Step Example
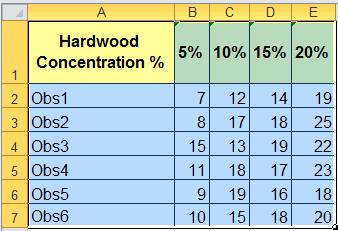
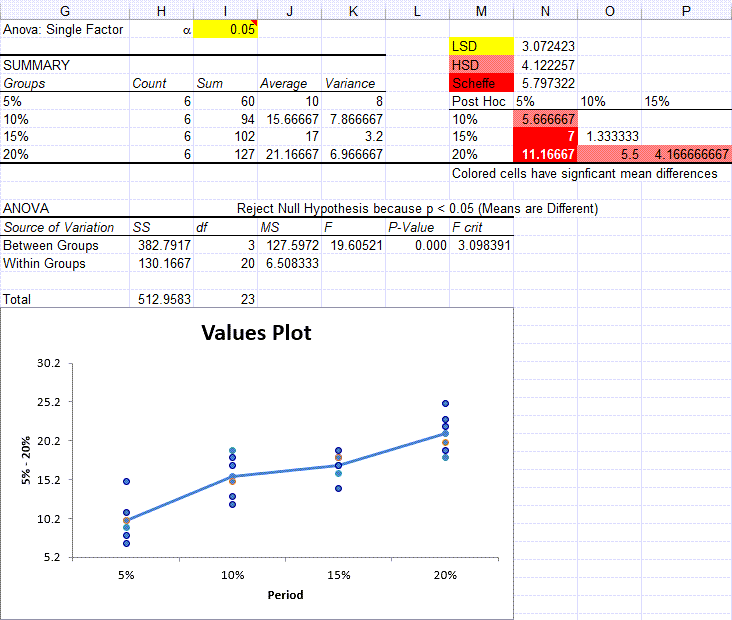
Imagine you manufacture paper bags and you want to improve the tensile strength of the bag. You suspect that changing the concentration of hardwood in the bag will change the tensile strength. You measure the tensile strength in pounds per square inch (PSI). So, you decide to test this at 5%, 10%, 15% and 20% hardwood concentration levels. These "levels" are also called "treatments."
To perform One-Way ANOVA in Excel using QI Macros follow these steps:
- Click and drag over your data to select it:
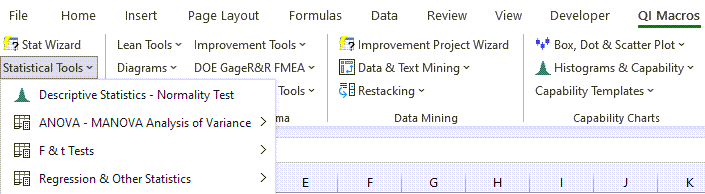
- Now, click on QI Macros menu > Statistical Tools > ANOVA > ANOVA Single Factor:
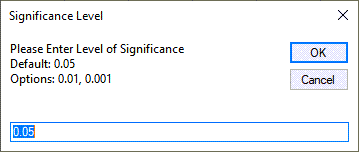
- QI Macros will prompt you for the significance level.
The default is 0.05 (95% confident).
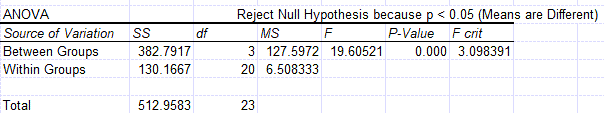
- QI Macros will perform the calculations and analyze the results for you:
QI Macros is Smart Enough to Interpret the Results for You
QI Macros built in code compares the p-value (it calculates) to the significance level (you input) to tell you what the results mean. You will see one of two results:
- Reject the null hypothesis - Means are different/Means are not the same.
- Cannot Reject the null hypothesis (Accept the null hypothesis) - Means are the same/Means are not different
In this example, QI Macros compares the p-value (0.000) to the significance (0.05) and tells you to "Reject the Null Hypothesis because p<0.05 (Means are Different)."
After a one-way ANOVA finds a significant difference in means, Post Hoc testing helps identify which of the differences are significant.
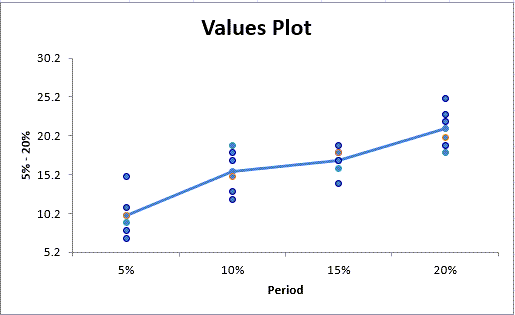
QI Macros Will Even Draw a Chart to Help You Visualize the Results
In this example, QI Macros draws a values plot. Compare the difference in Means using the line graph and the variation using the height of the dots.