Looking for a Friedman Test Template in Excel?
QI Macros has a ready-made Friedman test template for you.
Listen to our Friedman Test podcast below!
* Generated using QI Macros' source material via an AI model *
When Should You Use the Friedman Test?
The Friedman Test is like a two-way ANOVA test and is used to determine if 3 or more measurements from the same group of subjects are significantly different from each other.
Note: Excel does not do statistical tests of non-normal data (i.e. data that is not "bell shaped.") QI Macros adds this functionality with a set of of non-parametric test templates.
Example of a Friedman Test Using QI Macros Excel Template
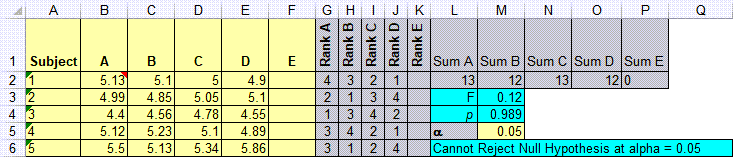
A pharmaceutical company wants to compare the reaction time for four drugs (A-D). Each drug is given to five subjects and reaction time is measured. The null hypothesis is that reaction times for the four drugs are the same. To run a Friedman Test:
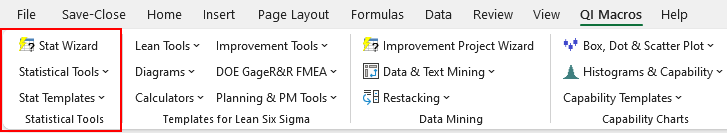
- Open the template by clicking on QI Macros menu > Stat Templates > Friedman.
- Input your data into the yellow shaded cells.
- QI Macros will perform the calculations for you:
Interpreting the Friedman Test Results
Since p (0.989) is greater than alpha (0.05), we cannot reject the null hypothesis that the reaction times are the same. In layman's terms we "accept the null hypothesis" - the reaction times are "the same".
Haven't you waited long enough?
Start running Friedman tests in just minutes.
Download a free 30-day trial. Run Friedman tests on your data now!
Friedman tests are one of many statistical tests included in QI Macros add-in for Excel.
QI Macros adds a new tab to Excel's menu, making it easy to find any tool you need. You will find the statistical tools and templates on the far left side of QI Macros menu.