Need to Transform Non-normal Data using LogNormal Transformation?
QI Macros can run a LogNormal Transformation on your data in seconds!
LogNormal Transformation uses a statistical calculation to transform non-normal data to a normal distribution so that additional analysis can be performed. LogNormal transformation requires data to be continuous (measured) and to only include positive values greater than zero (NO zeroes can be included).
Also, LogNormal transformation is especially helpful if your data is positively skewed, meaning your data has a long tail on the right side.
NOTE: The proper Lambda will be chosen automatically to provide the best normal distribution output.
Listen to our LogNormal Transformation podcast below!
* Generated using QI Macros' source material via an AI model *
LogNormal Transformation Example Using QI Macros for Excel:
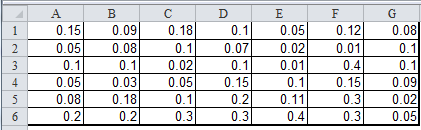
- Click and drag over your data to select it:
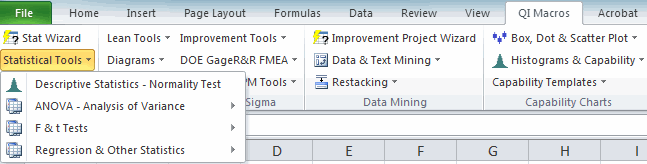
- Click on the QI Macros menu > Statistical Tools > Transformations > LogNormal:
- QI Macros will automatically transform your data and provide you with a Histogram, BoxPlot, Confidence Intervals, and Tolerance Limits, as well as Probability Plot outputs:

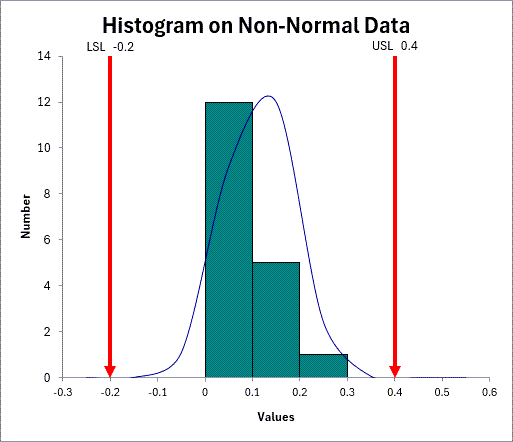
If we ran a histogram on the before and after data sets we can compare the non-normal and normal distributions.
Non-normal Data
Normalized Data


*Included in the 07.2024 version of QI Macros*
Stop Struggling with LogNormal Transformation!
Start conducting LogNormal Transformation in just minutes.
Download a free 30-day trial. Run LogNormal Transformation now!
QI Macros can draw these charts too!
