Need to run Crow-AMSAA in Excel?
QI Macros can do it for you!
Run Crow-AMSAA using QI Macros
- Select your data.
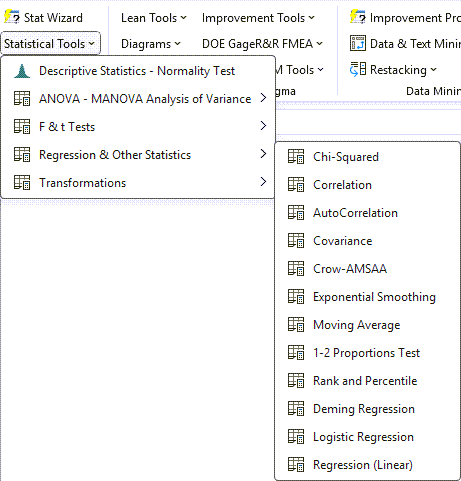
- Click on the QI Macros menu > Statistical Tools > Regression & Other Statistics > Crow-AMSAA.
- QI Macros will do the math and analysis for you.
Listen to our Crow-AMSAA podcast below!
* Generated using QI Macros' source material via an AI model *
What is Crow-AMSAA?
The Crow-AMSAA Model (also known as the Army Materiel Systems Analysis Activity model) is a reliability growth model used to track and forecast system reliability over time. It’s commonly applied in industries such as aerospace, defense, and automotive engineering to evaluate how reliability improves through testing and maintenance activities.
Example of Crow-AMSAA in Excel using QI Macros
NOTE: At least (20) data points are required for this method to be statistically viable.
- Select your data:
- Next, click on the QI Macros menu and choose Statistical Tools > Regression & Other Statistics > Crow-AMSAA:
-
Evaluate the Crow-AMSAA results:

If you would like to change the Axis Order, input (1) to set Column A as your X-Axis or (2) to set Column B as your X-Axis. In this example, the Axis toggle option can be found in cell N2.

The sample data shown above can be found in QI Macros Help > Open QI Macros Sample Data > statistical.xlsx > "Crow-AMSAA" tab
NOTE: Crow-AMSAA was included in the January 2025 version of QI Macros.
