Trying to do a Paired Two-Sample t-Test in Excel?
QI Macros can run a Paired t test for you!
Run a Paired Two-Sample t-Test using QI Macros:
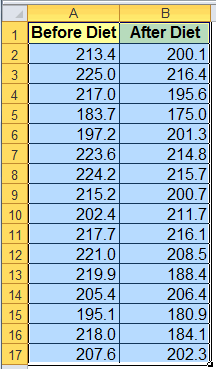
- Select your data.
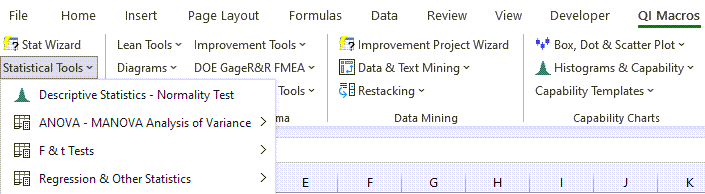
- Click on QI Macros menu > Statistical Tools > F & t Tests > Paired Two-Sample
- QI Macros will do the math and analysis for you.
When Should You Use the Paired t-Test?
In the constant quest to reduce variation and improve products, companies need to evaluate different alternatives. A t-Test using two paired samples compares two dependent sets of data to determine if the means (i.e., averages) are different from each other.
Paired t-Test Example Using QI Macros
If a diet claims to cause more than a 10 lb weight loss over a six month period, you could design a test using several individuals before and after weights. The samples are "paired" by each individual. You might want to know if the diet truly delivers greater than a 10 lb weight loss.
To conduct a Paired t-Test Using QI Macros for Excel, follow these steps:
- Input your data into Excel, then click and drag over it to select it:
- Next click on QI Macros >Statistical Tools > F & t Tests, then "t-Test: Paired two-sample for means":
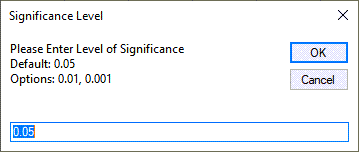
- QI Macros will prompt for a significance level (default = 0.05):
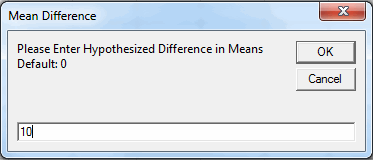
- And a hypothesized mean difference (in this case 10 lbs):
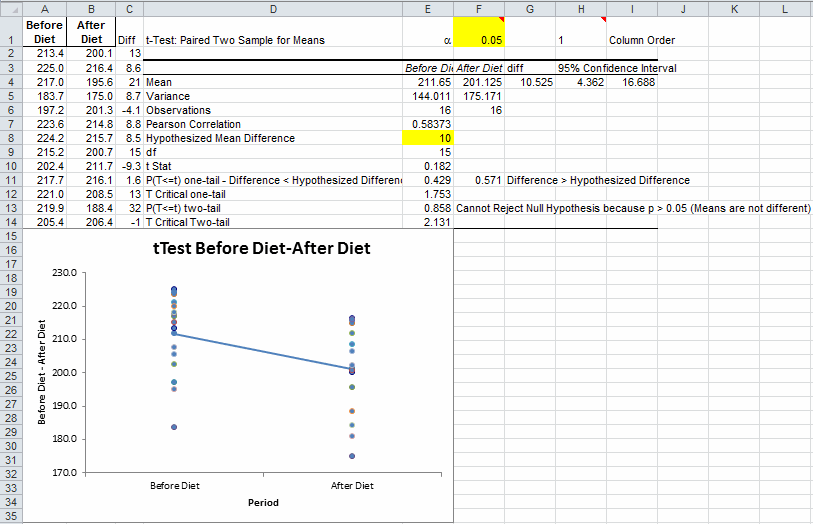
QI Macros paired t-Test macro will perform the calculations and interpret the results for you:
To change the order of your Paired t-Test results between the first and last columns:
QI Macros enables you to easily change the order of your data sets. See row 1 for the cell labeled column order (H1 Above). You have the option to update the "Column Order" by inputting value "1" (Column 1/Column 2) or "2" (Column 2/Column 1):
![]()
NOTE: Changing the order of your t-test column order will not change the Values Plot.
What's Cool about QI Macros Paired t-Test?
Interprets the results for you: QI Macros will compare the p-value (0.429) to the significance level (0.05) and indicate that you "Cannot Reject the Null Hypothesis, because p > 0.05" and that the "Means are not Different."
Draws a chart to help you visualize the results: QI Macros paired t-Test results include a values plot which helps you visualize the difference in means.
Interactive Results: QI Macros lets you change the significance level and Hypothesized Difference in Means to see what impact those changes have on your results. See yellow shaded cells in the image above.
