Need to Run One-Way ANOVA Post Hoc Tests in Excel?
QI Macros runs Post Hoc tests in Excel. Excel's data analysis tool doesn't.
To run one-way ANOVA using QI Macros
- Select your data.
- Click on QI Macros menu > Statistical Tools > ANOVA > ANOVA Single Factor.
- QI Macros will do the math and analysis for you.
After a one-way ANOVA finds a significant difference in means, Post Hoc testing helps identify which of the differences are significant.
Three Common Post Hoc Tests
Post Hoc tests compare the differences between the means with various factors to identify significant differences. There are a number of ways that these factors are determined, but LSD, HSD and Scheffe's are three of the more common ones:
- LSD - Fisher's Least Significant Difference
- HSD - Tukey's Honestly Significant Difference reduces Type 1 error.
- Scheffe's is the most conservative of the three
Note: Excel does not do post hoc tests; QI Macros adds this functionality.
Post hoc example using QI Macros and data from Montgomery's Intro to SPC book
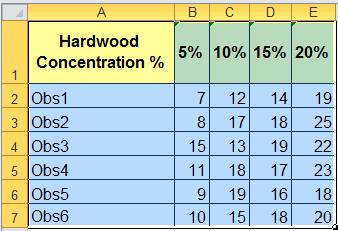
Using the tensile strength data in columns B to E,
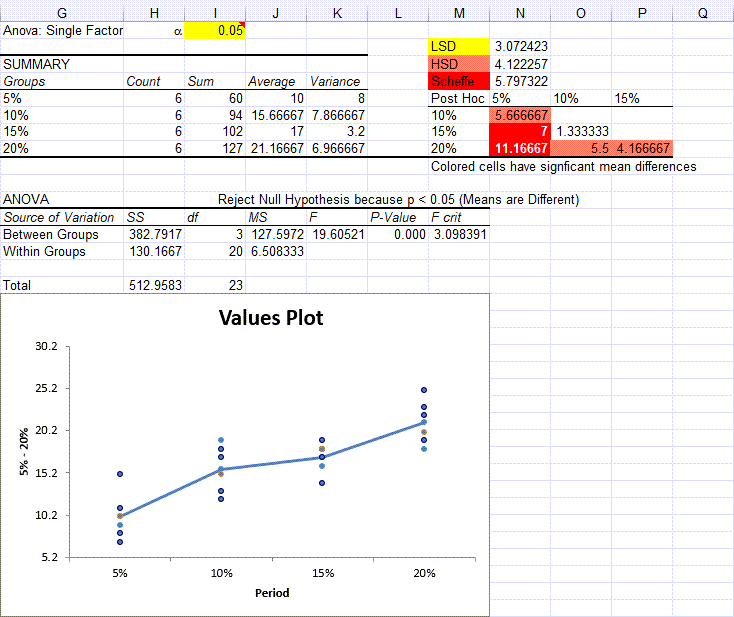
QI Macros calculations are shown in columns G to P. The Post Hoc tests are in cells M2:P8.
Interpretation of Results
QI Macros built in code compares the p-value (it calculates) to the significance level (you input) to tell you what the results mean. You will see one of two results:
- Reject the null hypothesis - Means are different/Means are not the same.
- Cannot Reject the null hypothesis (Accept the null hypothesis) - Means are the same/Means are not different
In this example, the p-value is less than the significance level 0.05, so the Means are considered Different. If the mean difference is greater than LSD, HSD or Scheffe's, the difference is considered significant.
QI Macros uses color coding to help you understand the post hoc tests.
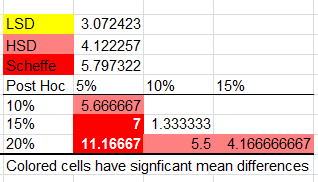
Since Scheffe > HSD > LSD, QI Macros identifies significant differences by shading the results as follows:
- greater than Scheffe's it is shown in red
- less than Scheffe but greater than HSD it is shown in rose
- less than HSD but greater than LSD, it is shown in yellow
- less than LSD, no shading
In the example below the difference between these tensile strengths is:
- greater than Scheffe (5.797) so they are shaded in red: 5% and 15%, 5% and 20%
- less than Scheffe (5.797) but greater than HSD (4.122) so they are shaded in rose: 5% and 10%, 10% and 20%, 15% and 20%
- less than HSD (4.122) but greater than LSD (3.072) so they are shaded in yellow: none
- less than LSD (3.072) so they are not shaded at all: 10% and 15%
Let QI Macros do the work for you.
QI Macros is the only SPC software that compares the p-value (0.000) to the significance (0.05) and tells you to "Reject the Null Hypothesis because p<0.05" and that the "Means are Different/Means are not the Same". Then the Post Hoc tests tell you which differences are significant.
