You Don't Have to be a Expert to Run an F-Test in Excel
QI Macros can run an f test and interpret the results for you!
Run F-tests using QI Macros:
- Select your data.
- Click on QI Macros menu > Statistical Tools > F & t Tests > F-test.
- QI Macros will do the math and analysis for you.
f test example using QI Macros add-in for Excel
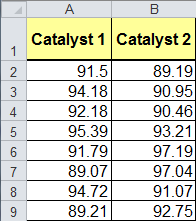
- Click and drag over your data to select it in Excel:
- Click on the QI Macros Menu > Statistical Tools > F & t Tests, and then select "F-test: Two-sample for Variance":
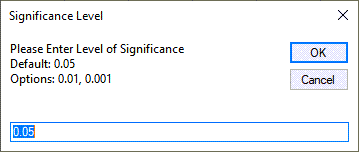
- QI Macros will prompt for a significance level (default = 0.05):
- QI Macros will perform the F-Test calculations and interpret the results for you:
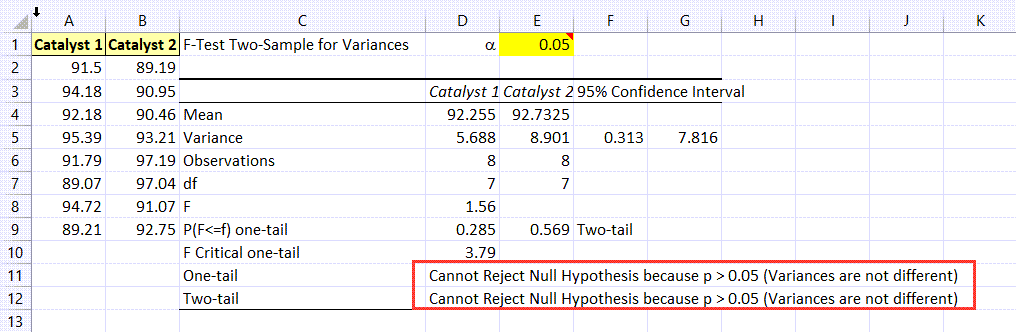
QI Macros interprets the f-test results for you
QI Macros built in code compares the p value to alpha and tells you what that means. In the above example, QI Macros tells you "Cannot Reject the Null Hypothesis because p > 0.05 (Variances are not Different).
Interactive Results:
QI Macros lets you change the significance level (cell E:1) to see what impact those changes have on your results.
Based on the F-test results, we now know which two sample t-test to run.
If you have non-normal data, consider running a Levene's test.
