Looking for a Test of Proportion Template in Excel?
QI Macros has a ready made Test of Proportions template for you.
Use a test of proportions template to compute a confidence interval and perform a hypothesis test of the proportion.
Example of Test of Proportion Test Using QI Macros Template
Let's say a manufacturer claims that his products are less than 3% defective. You can take a sample of the products and determine whether or not the actual percent defective is consistent with his claim.
- If the sample data isn't summarized, use PivotTables to summarize the trials and successes
- To open QI Macros template, click on QI Macros > Stat Templates > 1-2 Proportion Tests:
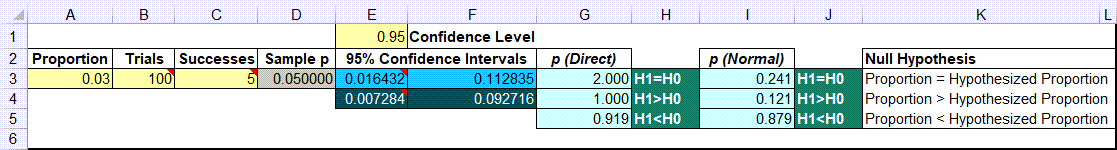
- Enter desired proportion in A3. The number should be between 0 and 1. (e.g., 3% is 0.03)
- Enter number of trials in B3 (100 products)
- Enter number of successes in C3 (e.g., defects in 100 products)
- Enter confidence Level in E1 (.95 = 95%)
- Null hypothesis is H1=H0 (sample proportion = proportion). QI Macros calculates p values using the direct and normal approximation methods for H1<>H0, H1>H0 and H1<H0.
- If Cell H3:H5 (or J3:J5) is green: Cannot reject the null hypothesis (accept the null hypothesis)
- If Cell H3:H5 is red: Reject the null hypothesis
In this example with five defects in 100 samples, you cannot reject the null hypothesis (accept the null hypothesis).
QI Macros also contains a Test of Two Proportions template.
Haven't you waited long enough?
Start running Test of a proportion in just minutes.
Download a free 30-day trial. Run Test of a proportion on your data now!
Test of a proportion are one of many statistical tests included in QI Macros add-in for Excel.
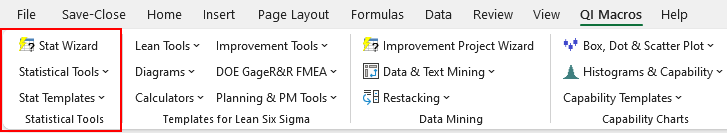
QI Macros adds a new tab to Excel's menu, making it easy to find any tool you need. You will find the statistical tools and templates on the far left side of QI Macros menu.