Want to Run Grubbs' Outlier Test in Excel but Don't Know How?
QI Macros can do it for you!
Run a Grubbs' Outlier Test using QI Macros
- Click on QI Macros menu > Stat Templates >
Dixons Q - Grubbs Outlier Tests. - Click on the "Grubbs Outlier Test" tab.
- Input your data in column A and QI Macros will do the rest!
What is Grubbs' Outlier Test?
Grubbs' Outlier Test is used to identify single outliers for normally distributed data sets. If an outlier is identified, this suggests that said outlier does not belong to the same population.
Please keep in mind that if your data set is not normally distributed, this test will become inaccurate in identifying an outlier.
With that, Alpha is considered your Significance Level, which is defaulted at 0.05 (this indicates a 5% risk of misidentifying a point as an outlier).
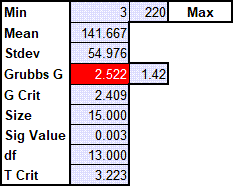
If "Grubbs G" (GG) is greater than "G Crit" (G Critical), the GG value will turn red, thus indicating there is an outlier in your population. This outlier may then be justifiably removed from further analysis. However, if your GG value does NOT turn red, there is no outlier identified in your data set.
NOTE: This test should not be used when your sample size includes (6) or less observations. If used, the test may become inaccurate and identify most points as outliers.
How do I run a Grubbs' Outlier Test in Excel using QI Macros
- Input your data in cells A2:A31:
- Update your α value in cell D2 (default is 0.05):
- Your metrics will be automatically calculated in cells D3:D11:
- If cell D6 turns red, this indicates that there is an outlier in your data set. However, if cell D6 does not turn red, your data set does not contain an outlier.

![]()

*This functionality introduced in the April 2024 version of QI Macros*

