Want to Run Autocorrelation in Excel but Don't Know How?
QI Macros can do it for you!
Run AutoCorrelation Analysis using QI Macros
- Select your data.
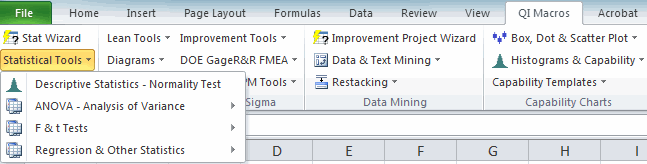
- Click on QI Macros menu > Statistical Tools > Regression > Autocorrelation.
- QI Macros will do the math and analysis for you.
Listen to our Autocorrelation podcast below!
* Generated using QI Macros' source material via an AI model *
What is Autocorrelation Analysis?
Autocorrelation refers to the degree of correlation between the values of the same variables across different observations in the data. Autocorrelation is most often used in the context of time series data in which observations occur at different points in time (e.g., air temperature measured on different days of the month.)
For example, seasonal data like air temperature rises and falls. You might expect the air temperature on the 1st day of the month to be more similar to the temperature on the 2nd day compared to the 31st day. If the temperature values that occurred closer together in time are, in fact, more similar than the temperature values that occurred farther apart in time, the data would be autocorrelated.
Example of Conducting Autocorrelation Analysis in Excel using QI Macros
- Select one column of data:
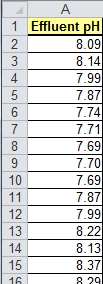
The sample data shown above is found in QI Macros Help > Open QI Macros Sample Data> XmRChart.xlsx > Autocorrelation tab - Next, click on the QI Macros menu and choose Statistical Tools > Regression & Other Statistics > AutoCorrelation:
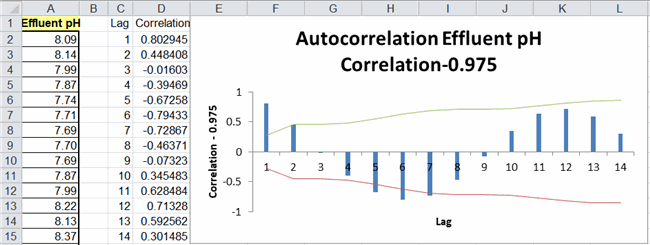
- Evaluate the Autocorrelation Results:
NOTE: Maximum correlations is set to 25.
Correlations for lags:
- If a correlation is outside of the confidence limits (e.g., lag 1 = 0.8), the data is autocorrelated at lag 1.
In this example:
- Lag 1 has a positive autocorrelation (0.8)
- Lag 5 and 6 have a negative autocorrelation (-0.67 and -0.79)
*Functionality introduced in the July 2022 version of QI Macros*
