Can I Do Statistical Analysis in Excel?
Yes...but its easier and more accurate to do it using QI Macros add-in
To Run Statistical Tests using QI Macros
- Select your data in Excel.
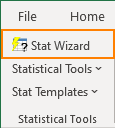
- Click on QI Macros menu and select the test you want. If you are not sure which test, click on the Stat Wizard.
- QI Macros will do the math and analysis for you.
Excel's data analysis tools are picky about the way you organize and order your data. If you switch the order of columns, you might get the wrong result. QI Macros mistake proofs the data selection process, helps you select the right test and even interprets the results for you.
What are the types of statistical tests and tools in QI Macros?
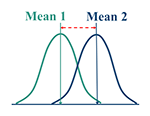
Tests of Means
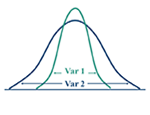
Tests of Variances
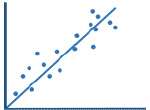
Tests of Relationships
And More...
Special Features in QI Macros to Answer These Questions
QI Macros has unique features that help you every step of the way.
How do I organize my data before I run a statistical test?
It is best to organize your data in columns before running a test. Excel is picky about the order of columns, but QI Macros contains code that mistake proofs the calculations. QI Macros also contains sample data for each test to help you better understand how to organize your data.
Which type of statistical analysis should I run?
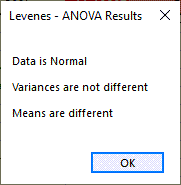
QI Macros is the only statistical software that will analyze your data and select the correct statistical tests for you. Just select your data and then select the Stat Wizard. QI Macros will run the possible tests and will display a box with a summary of the results.
Stat Wizard on QI Macros Menu
Stat Wizard Summary Results
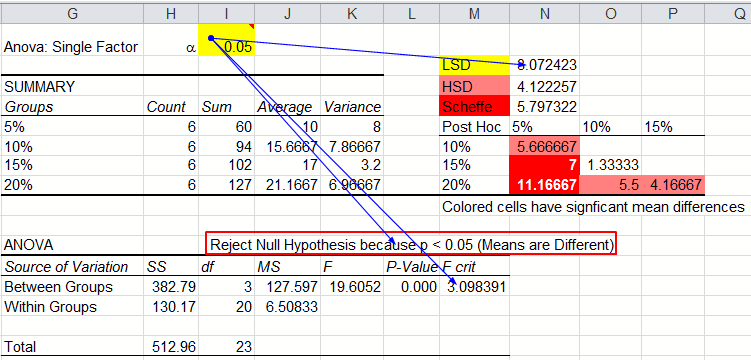
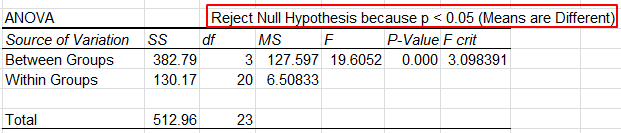
What do these numbers mean?
How do I know if I can reject my null hypothesis or not?
Each hypothesis test in QI Macros will tell you whether you should reject the null hypothesis or cannot reject the null hypothesis and why.
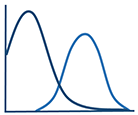
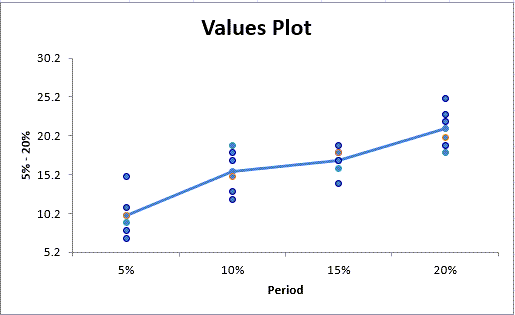
Many test results also contain a chart like a values plot to help you visualize the analysis.
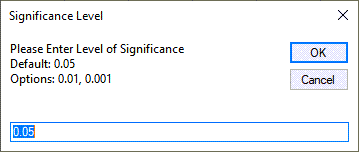
Can I define or change the significance level?
Each QI Macros test will prompt you for the significance level (default is .05). The results page will show you the level that was used in the calculations. To change the value, simply edit the cell. The dependent calculations will automatically update.
Significance level prompt
Change significance level and see the impact