Struggling to Run a One Sample t-Test in Excel?
QI Macros can run a t-test for you in seconds!
Run a
one-sample t-test
using
QI Macros
- Select your data.
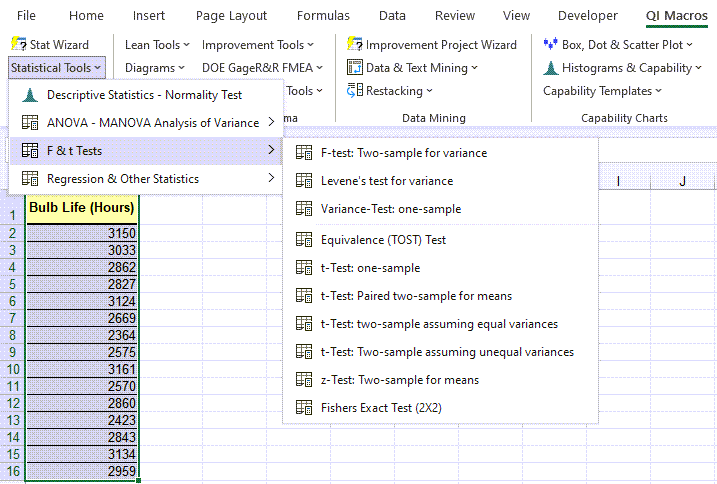
- Click on QI Macros menu > Statistical Tools > F & t Tests > One-Sample t-Test
- QI Macros will do the math and analysis for you.
What is a One Sample t test?
A one sample t-Test compares test data to a specific value. It helps determine if the sample is greater than, less than or equal to the value.
Note: Excel does NOT do one-sample t-tests; QI Macros adds this functionality.
One Sample t-Test Example Using QI Macros
Let's say you want to know if the life of a light bulb is greater than 2,500 hours. Take your sample and input the data in Excel.
- Click and drag over the data to select it.
- Next, click on the QI Macros Menu > Statistical Tools > F & t Tests, and then select "t-Test: one sample":
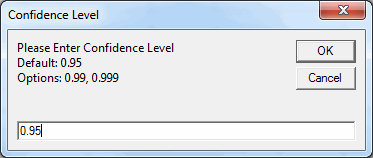
- QI Macros will prompt for a confidence level (default = 0.95)
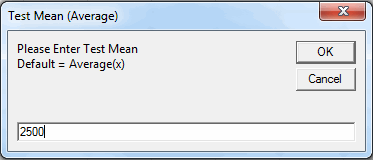
and a Test Mean (light bulb life is less than or equal to 2,500 hours)
QI Macros will perform the calculations and interpret the results for you:
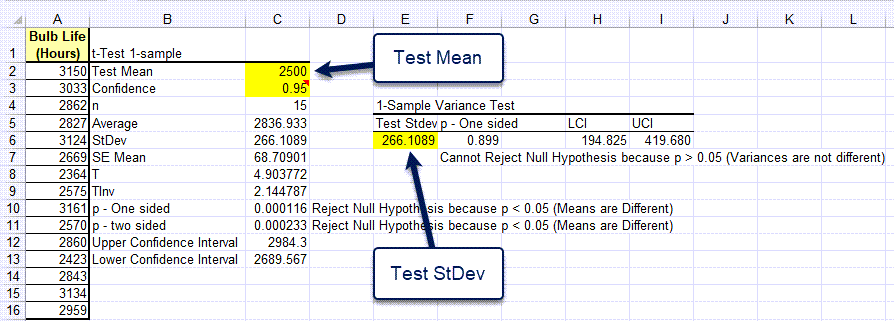
In this example, p-value = 0.00016 and alpha = 0.05 (1 - .95 the confidence level). Since p < .05 we "Reject the Null Hypothesis (Means are Different)." You can also change the test mean and the calculations with change.
One Sample Variance Test
To test the variance, put the standard deviation (Stdev) test value in cell E6. The p-value will calculate in F6.
Note: TInv means "T Inverse" and is used in calculating the upper and lower confidence intervals.
What's Cool about QI Macros Statistical Add-in for Excel?
Interprets the Results for You: QI Macros compares the p value to alpha and tells you what that means. In the above example, QI Macros tells you to "Reject the Null Hypothesis," because p < 0.05 (Means are Different).
Interactive Results: QI Macros lets you change the confidence level and test mean to see what impact those changes have on your results. See cells shaded yellow that can be changed.
Another t-Test One Sample Example Using Bank Wait Times
Let's say you want to know if wait times in a branch bank are not greater than three minutes at a 95% confidence level.
- H0 <= 3 minutes
- Ha > 3 minutes
Mystery shoppers routinely visit the branch and collect their wait time. This gives us the data we need to test the hypothesis.
- Select your data and then click on QI Macros Menu > Statistical Tools > F & t Tests, and then select "t-Test: one sample."
- Answer the prompts: Confidence level .95 and test mean 3.
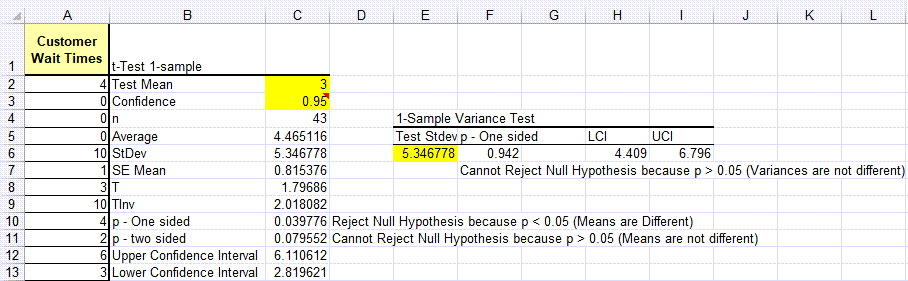
The one-sided p value < a (.039776 is less than 0.05 (1-0.95)), so we must "Reject the Null Hypothesis" that bank wait times are less than or equal to 3 minutes.
We can say that we are 95% confident that wait times are greater than 3 minutes.
