Struggling with Hypothesis Testing in Excel?
QI Macros Makes Hypothesis Testing Easy,
Even If You Don't Know ANYTHING About Statistics!
Run Any Hypothesis Test using QI Macros
- Select your data.
- Click on QI Macros menu > Statistical Tools > the test you want
- QI Macros will do the math and analysis for you.
What is a Hypothesis Test?
A hypothesis test helps identify ways to reduce costs and improve quality.
Hypothesis testing asks the question: Are two or more sets of data the same or different, statistically.
For companies working to improve operations, hypothesis tests help identify differences between machines, formulas, raw materials, etc. and whether the differences are statistically significant or not. Without such testing, teams can run around changing machine settings, formulas and so on causing more variation. These knee-jerk responses can amplify variation and cause more problems than doing nothing at all.
Three Types of Hypothesis Tests
- Classical Method - comparing a test statistic to a critical value
- p Value Method - the probability of a test statistic being contrary to the null hypothesis
- Confidence Interval Method - is the test statistic between or outside of the confidence interval
How to Conduct a Hypothesis Test
- Define the null (H0) and an alternate (Ha) hypothesis.
- Conduct the test.
- Using data from the test:
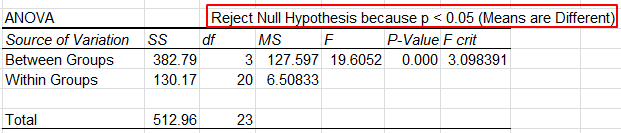
- Calculate the test statistic and the critical value (t-Test, F-test, z-Test, ANOVA, etc.).
- Calculate a p value and compare it to a significance level (a) or confidence level (1-a).
- Interpret the results to determine if you "cannot reject null hypothesis (accept null hypothesis)" or "reject the null hypothesis."

Which test do I run?
What do these numbers mean?
QI Macros for Excel Makes Hypothesis Testing as Easy as 1-2-3!
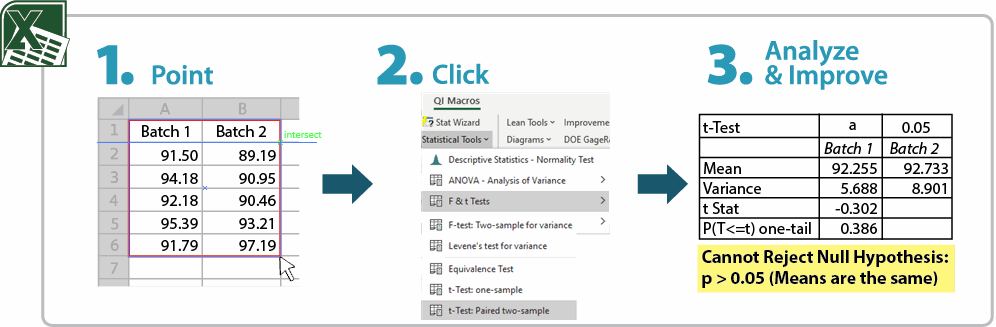
QI Macros adds a new tab to Excel's menu:
- Just input your data into an Excel spreadsheet and select it.
- Click on QI Macros menu, Statistical Tools and the test you want to run (t test, f test, z test, ANOVA, etc.).
If you are not sure which test to run, QI Macros Stat Wizard will analyze your data and run the possible tests for you. - QI Macros performs all of the calculations AND interprets the results for you:
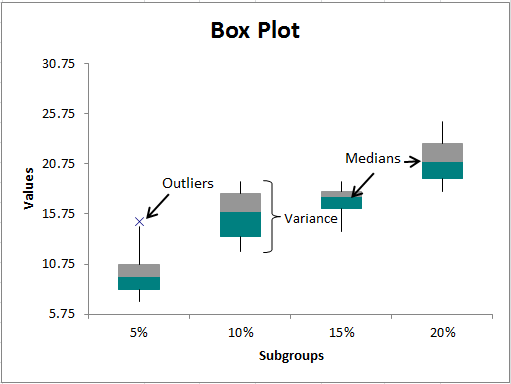
QI Macros Will Also Draw Charts to Help You Visualize the Differences in Your Data Sets
Cheat Sheet to Help You Interpret the Results Yourself
Hypothesis Test |
Compare |
Result |
What Does It Mean? |
| Classical Method | test statistic > critical value (i.e. F > F crit) |
Reject the null hypothesis | Means or Variances are Different Means or Variances are not the Same |
| Classical Method | test statistic < critical value (i.e. F < F crit) |
Cannot Reject the null hypothesis/Accept the null hypothesis | Means or Variances are the Same Means or Variances are not Different |
| p value Method | p value < a | Reject the null hypothesis | Means or Variances are Different Means or Variances are not the Same |
| p value Method | p value > a | Cannot Reject the null hypothesis/Accept the null hypothesis | Means or Variances are the Same Means or Variances are not Different |
