Want to Run a Kruskal-Wallis Test in Excel?
QI Macros has a ready-made Kruskal-Wallis template for you!
When Should You Use the Kruskal-Wallis Test?
A Kruskal-Wallis test is like an Analysis of Variance (ANOVA). It is a non-parametric test that compares unmatched groups. Samples must be random, independent and five or more per sample.
Note: Excel does not do statistical tests of non-normal (i.e., not "bell shaped") data. QI Macros, adds this functionality with a set of of non-parametric statistical test templates.
Kruskal-Wallis Example Using QI Macros Template
A golfer wants to compare three drivers to determine which one he can hit the longest. He hits five drives with each driver and measures the distance.
To conduct a Kruskal-Wallis test using QI Macros template:
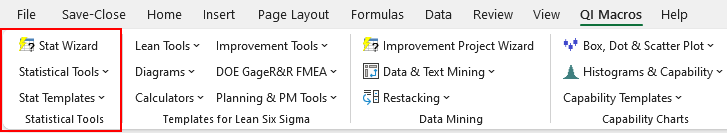
- Click on the QI Macros menu > Stat Templates > Kruskal-Wallis to open the non-parametric test template. Then select the "Kruskal-Wallis" tab.
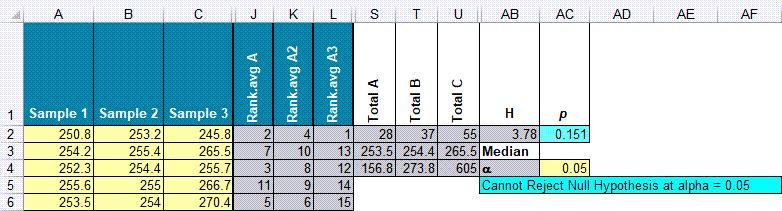
- Input your data into the yellow shaded cells in columns A:I.
- QI Macros will perform the calculations in columns J:R and display the results in columns S:AA. In the example, below we have hidden the unused columns. (Note never delete rows or columns in QI Macros templates as you may accidentally break formulas.)
Interpreting Kruskal-Wallis Results
Since p (0.151) is greater than alpha* (0.05), we cannot reject the null hypothesis that the distance of all three drivers is the same. In layman's terms, that means you would "accept the null hypothesis" = the distance is the same.
If p was less than alpha, we would reject the null hypothesis.
*Default Significance Level is 0.05*
H: This is the test statistic that helps you determine whether the medians of two (or more) groups are different, in combination with your p value.
Haven't you waited long enough?
Start running Kruskal-Wallis tests in just minutes.
Download a free 30-day trial. Run Kruskal-Wallis tests on your data now!
Kruskal-Wallis tests are one of many statistical tests included in QI Macros add-in for Excel.
QI Macros adds a new tab to Excel's menu, making it easy to find any tool you need. You will find the statistical tools and templates on the far left side of QI Macros menu.