Need Binary Logistic Regression in Excel?
QI Macros can do it for you!
Run Binary Logistic Regression using QI Macros
- Select your data.
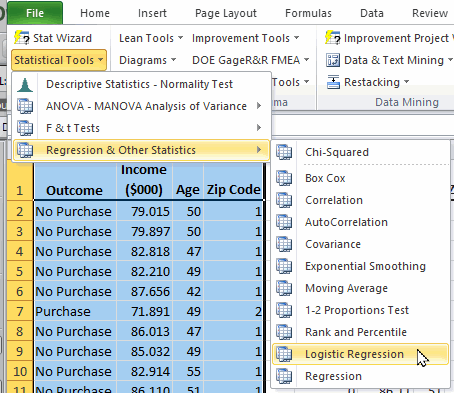
- Click on the Binary Macros menu > Statistical Tools > Regression & Other Statistics > Logistic Regression.
- QI Macros will do the math and analysis for you.
Listen to our Binary Logistic Regression podcast below!
* Generated using QI Macros' source material via an AI model *
What is Binary Logistic Regression Analysis?
Binary Logistic Regression estimates the probability of an event occurring (e.g., voted or didn't vote/passed or didn't pass), based on a given dataset of independent variables. Since the outcome is a probability, the dependent variable is bounded between 0 and 1.
Example of Binary Logistic Regression in Excel using QI Macros
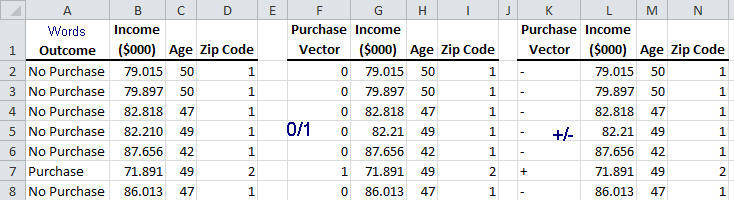
- Select two or more columns of data (NOTE: The first column of your data must be setup as 1 (pass) or 0 (fail), purchase/no purchase, good/bad, etc. while the next column(s) in your data set should include your predictors):
- Next, click on the QI Macros menu and choose Statistical Tools > Regression & Other Statistics > Logistic Regression (Binary):
-
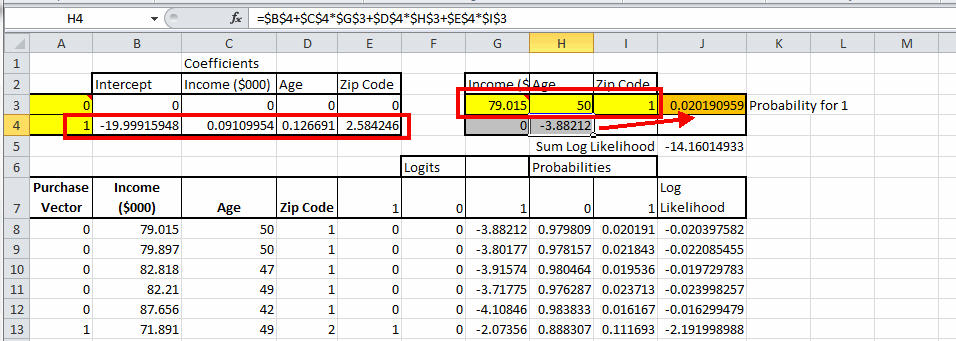
Evaluate the Binary Logistic Regression results:
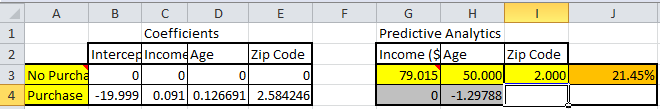
If we change the Zip Code to 2, the probability of a sale increases 10X:
The sample data shown above is found in QI Macros Help > Open QI Macros Sample Data > statistical.xlsx > "Binomial Logistic Regression" tab
Excel's Solver add-in is used to perform the Coefficients calculations.
If Solver is not enabled on your PC, you will be provided with information about how to calculate the Coefficients manually, using Solver.
If you are using a Mac, see instructions at the bottom of this example.
In this example:
- The probability of someone making a purchase is derived from past data.
- The income, age, and Zip Code can then be used to predict the probability that a person will purchase the product.
If using a Mac:
- Click on the "Data" tab from your Excel sub-ribbon and select Solver.
- Set Objective to: $H$5
- And change the Variable Cells to: $B$4:$(last column in Coefficients table)$4.
- Next, select "Add" in "Subject to the Constraints": $B$4:$(last column in Coefficients table)$4 >= -1000
- And finally, click the "Solve" button.
Why am I receiving #NUM in my regression output?
You are receiving this output, because your Constraint(s) in Solver need to be either updated or included in your worksheet. This is due to the EXP calculation crashing within Excel.
To add Constraints:
- Select Data > Solver in your worksheet.
- Choose the Constraint you want to update and select "Add."
- Select the lowest row in your Coefficients table, choose <=, and input 500 as your upper Constraint.
- Next, select OK - your upper Constraint has now been added.
- If your outputs change to values, continue to update the Constraint to the largest value possible before the output values change back to #NUM - then revert the Constraint back to the largest value.
To update Constraints:
- Select Data > Solver in your worksheet.
- Choose the Constraint you want to update and select "Change."
- Next, update your upper Constraint value - start by changing the Constraint to 300 to see if your #NUM output changes to values.
- If your outputs change to values, continue to update the Constraint to the largest value possible before the output values change back to #NUM - then revert the Constraint back to the largest value.
NOTE: Both Binary Logistic Regression and Multinomial Logistic Regression were included in the October 2023 version of QI Macros.
