p value Calculator in Excel
Calculating a p value is Easy - Interpreting It is Hard
One subject that inspires much head-desk banging is interpreting the results of statistical hypothesis tests. It seems that students easily learn how to perform the calculations required by a given test but get hung up on interpreting the results.- Student Post on Cross Validated
Any Statistical Software package, including Excel, can calculate p values. However, very few will help you interpret the results. Fortunately, QI Macros Add-in for Excel does both.
QI Macros Calculates p values and Interprets Them for You
A p value (probability value) is used in hypothesis testing to determine the statistical significance of what a sample is telling you about a population.
Value |
Strength of Evidence |
Reject the Null Hypothesis? |
Means and Variances |
|---|---|---|---|
small p-value |
Strong evidence against the null hypothesis | Reject the null hypothesis | Means or Variances are not the same Means are Different |
| large p-value greater than 0.05 |
Weak evidence against the null hypothesis | Cannot reject the null hypothesis | Means or Variances are the same Means are Not Different |
| p-value = .05 or is close to it |
Evidence does not point strongly either way |
Can either reject or cannot reject the null hypothesis |
Means or Variances may be the same |
Note: .05 and .01 are the most common levels of significance used.
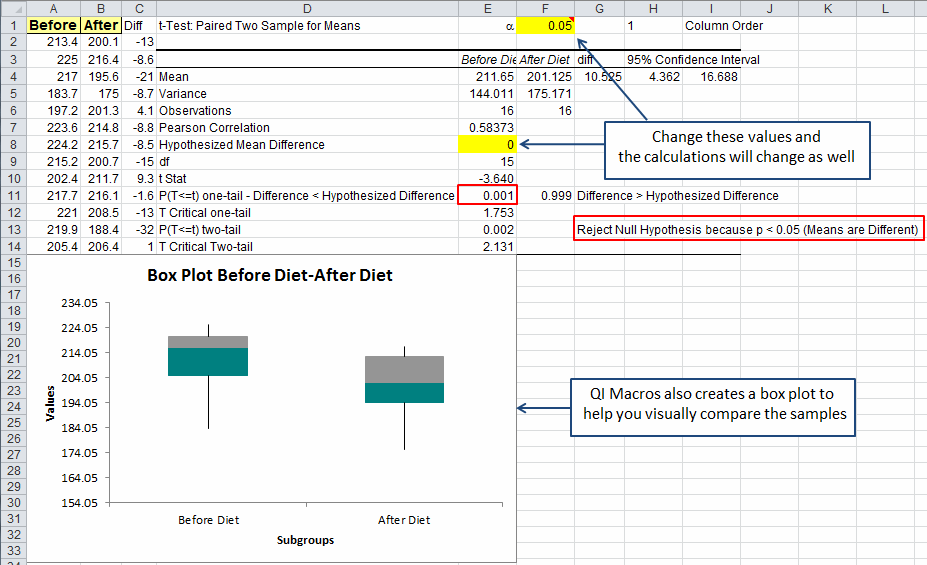
Example of a QI Macros t test and p value calculation

QI Macros compares the p-value to the significance level for you and translates that into whether you can reject the null hypothesis or cannot reject the null hypothesis (accept the null hypothesis). It further interprets whether the means are equal (the same/are not different) or not equal (not the same/are different.)
QI Macros results are also interactive and let you change the significance level and Hypothesized Difference in Means to see what impact those changes have on your results. See areas outlined in red in the results image above.
Why Choose QI Macros Statistical Software for Excel?
![]()
Easy to Use
- Works Right in Excel
- Interprets p-values for You
- Accurate No-Worry Results
- Free Training Anytime
![]()
Proven and Trusted
- More than 100,000 users
- In Over 80 Countries
- Five Star CNET Rating - Virus Free
![]()
Affordable
- Only $369 USD
Quantity Discounts Available - No annual fees
- Free Technical Support

