Want to Run a Wilcoxon Signed Rank Test in Excel?
QI Macros has a Ready-Made template for you!
When to Use the Wilcoxon Signed Rank Test
A Wilcoxon Signed Rank test compares the differences between two paired samples to determine if the data is symmetrical. If so, the median difference would be close to zero. If not, the data is asymmetrical. Consider the following example.
Wilcoxon Signed Rank Test Example Using QI Macros Template
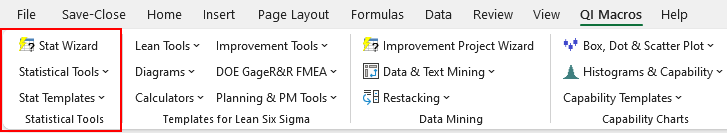
- To open the template, click the QI Macros menu > Stat Templates > Wilcoxon
- Next, input your data into the yellow shaded areas.
- QI Macros performs the calculations and interprets the results for you.
Imagine a credit union would like to loan more money. And that they think having more detailed information on the loan application results in larger loans. (From Applied Statistics, John Neder.) Using data from 20 loan officers on case studies with limited and detailed information, they determine the amount of money loaned:
![]()
Interpreting the Results
Since p (0.001) is less than alpha (0.05) reject the null hypothesis that the two levels of detail result in the same loan amount. So, if the credit union wants to loan more money, get more detail.
Wilcoxon 1-Sample Test
The same type of test can be applied to one-sample and compared to an expected median. The following example compares light bulb life to a median of 2,500 hours:
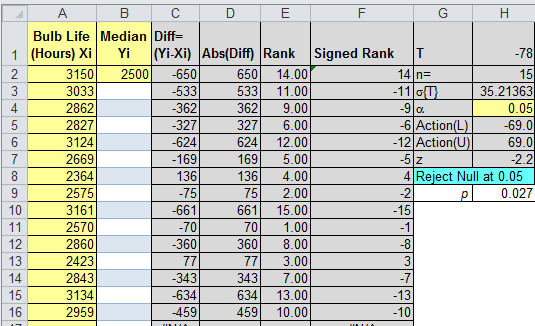
Interpreting the Results
At alpha = 0.05 we reject the null hypothesis because p (0.027) < 0.05. The bulb life, in this case, has a median greater than 2,500.
Haven't you waited long enough?
Start running Wilcoxon Signed Rank tests in just minutes.
Download a free 30-day trial. Run Wilcoxon Signed Rank tests on your data now!
Wilcoxon Signed Rank tests are one of many statistical tests included in QI Macros add-in for Excel.
QI Macros adds a new tab to Excel's menu, making it easy to find any tool you need. You will find the statistical tools and templates on the far left side of QI Macros menu.