Struggling with Two-Way ANOVA With Replication in Excel?
QI Macros will run Two-way Anova for you AND interpret the results.
Run ANOVA Two-factor with replication using QI Macros:
- Select your data.
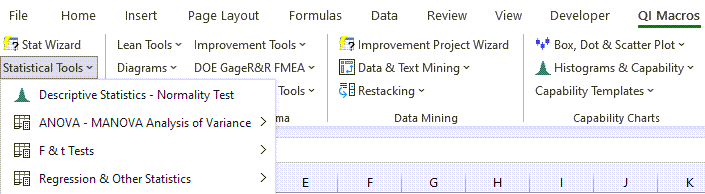
- Click on QI Macros menu > Statistical Tools > ANOVA > ANOVA Two Factor With Replication
- QI Macros will do the math and analysis for you.
Two-Way ANOVA (ANalysis Of Variance) , also known as two-factor ANOVA, can help you determine if two or more samples have the same "mean" or average. Note: Your data must be normal to use ANOVA.
Listen to our Two-Way ANOVA podcast below!
* Generated using QI Macros' source material via an AI model *
What Makes QI Macros Statistical Add-in for Excel Unique?
- Works Right in Excel: point and click simple.
- Interprets the results for you: QI Macros built in code will tell you what the numbers mean.
- Draws a chart to help you visualize the comparison between data sets.
If you are not sure which statistical test to run, QI Macros Stat Wizard will select the right test for you.
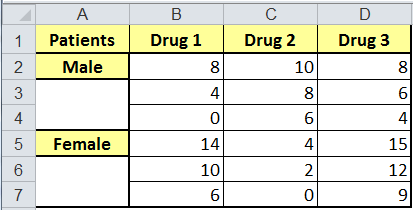
Two-Way ANOVA Test With Replication Example
What if you have two populations of patients (male/female) and three different kinds of medications, and you want to evaluate their effectiveness? You might run a study with three "replications", three men and three women.
To Conduct the Anova Test in Excel Using QI Macros:
- Click and drag over your data to select it:
- Click on QI Macros Menu, Statistical Tools and then ANOVA Two Factor with Replication:
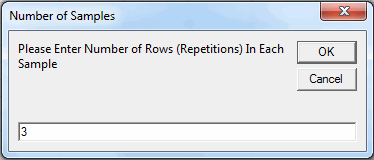
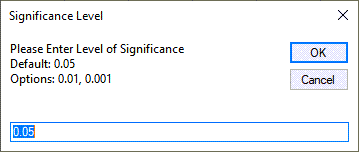
- QI Macros will prompt you for how many rows are in each sample (three) and for a significance level. Default is alpha=0.05 for a 95% confidence.
- QI Macros will perform all of the calculations and interpret the results for you:
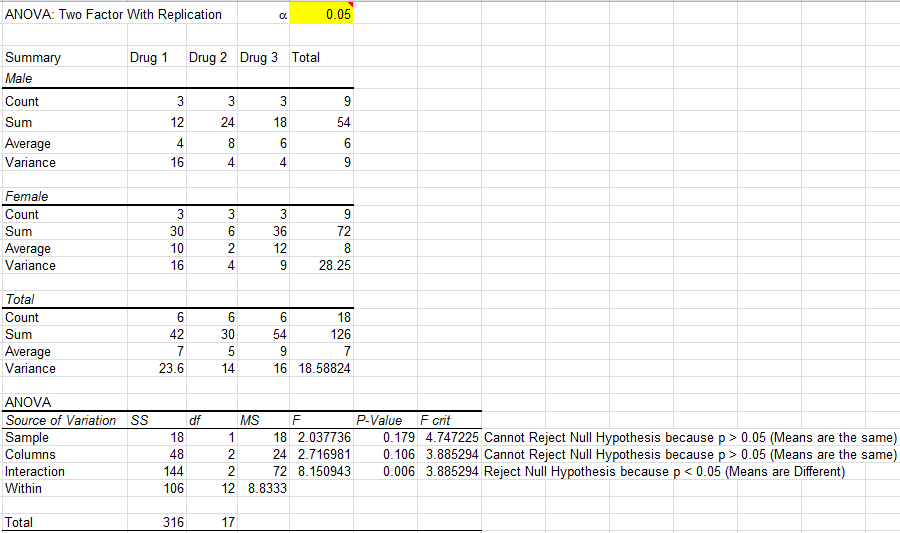
Interpretation of the Two-Way ANOVA Results
QI Macros built in code compares the p-values (0.179) to the significance level (0.05) and tells you: "Cannot Reject the Null Hypothesis (Accept the Null Hypothesis) because p>0.05" and that the "Means are not Different/Means are the Same".
Tips on Setting Up Your Data for Two-Factor with Replication
To analyze data, Excel requires you to set the data up in a way that can be analyzed.
The example below shows how to set up the data for two categories of patients treated with three different drugs:
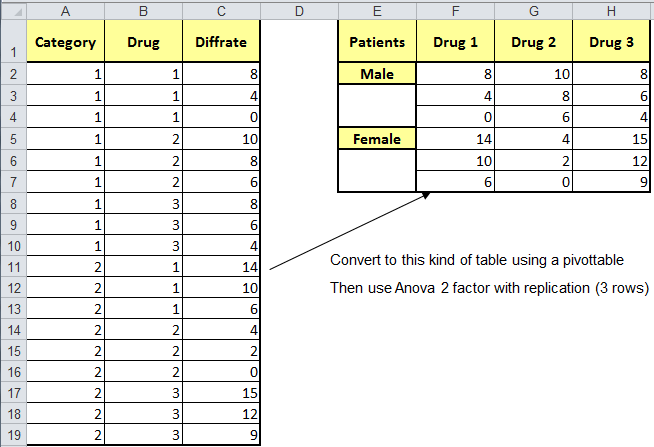
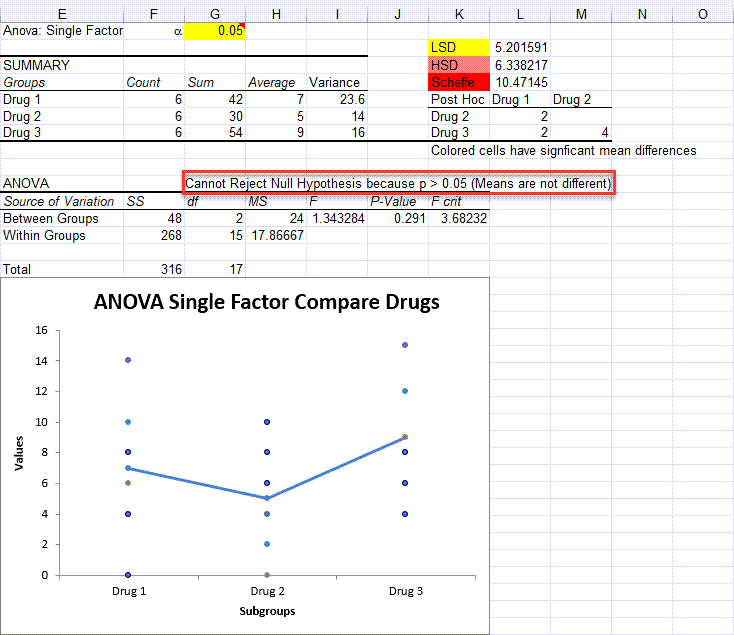
Then, if you're just interested in the single factor DRUGS, select and run a ANOVA single factor on the three drug columns:
If you're interested in a ANOVA two-factor analysis (patients vs drugs), select and run a two-factor analysis with repetition (more than one patient in the category receives the same drug).
