Struggling to Run Covariance Analysis in Excel?
QI Macros can conduct covariance analysis for you!
Analyze Covariance using QI Macros
- Select your data.
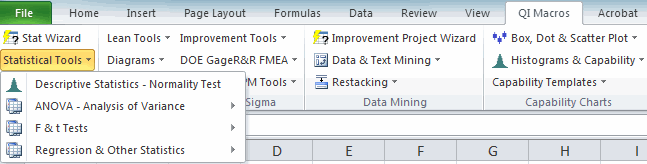
- Click on QI Macros menu > Statistical Tools > Regression & Other Statistics > Covariance.
- QI Macros will do the math and analysis for you.
What is Covariance?
Imagine that you'd like to know if variation in one variable is related to the variation in another. While statistical analysis cannot prove that one thing causes another, it can determine if there is a relationship between the variables which gives a direction to the analysis.
Systolic Blood Pressure vs Weight Covariance Example Using QI Macros
While Excel's data analysis toolpak can run covariance analysis, it is difficult to use. QI Macros add-in for Excel makes running covariance as easy as 1-2-3.
-
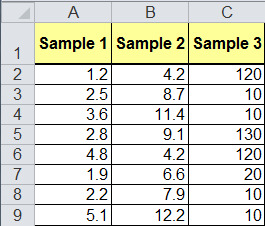
Select your data
Click and drag over two or more columns of data:
- Click on QI Macros menu > Statistical Tools >Regression and Other Statistics > Covariance:
-
Evaluate the Covariance Results:
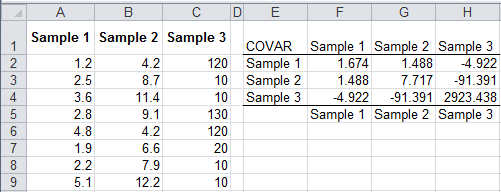
Two variables can be positively correlated (more of one means more of another) or negatively correlated (more of one means less of another).
