Need Multinomial Logistic Regression in Excel?
QI Macros can do it for you!
Run Multinomial Logistic Regression using QI Macros
- Select your data.
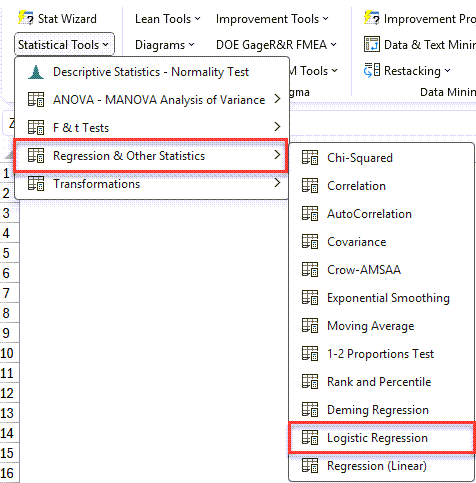
- Click on QI Macros menu > Statistical Tools > Regression & Other Statistics > Logistic Regression.
- QI Macros will do the math and analysis for you.
Listen to our Multinomial Logistic Regression podcast below!
* Generated using QI Macros' source material via an AI model *
What is Multinomial Logistic Regression Analysis?
Multinomial Logistic Regression (a.k.a., Nominal Logistic Regression) works the same way as binomial logistic regression except there can be 3 OR MORE dependent variables.
One dependent variable is chosen as the comparison variable, while the others are used to find coefficients for prediction.
Example of Multinomial Logistic Regression in Excel using QI Macros
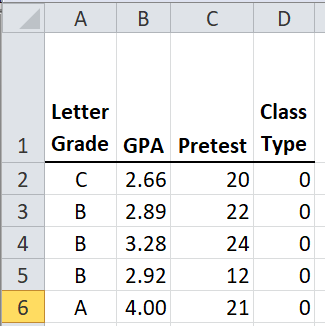
In this example, there are three letter grades achieved and the student’s GPA, pretest score, and participation in new course design. The data was collected from various students over time and the goal is to predict a student's grade using their GPA, pretest score, and type of class.
-
In Excel, select the data in cells A1:D33. (NOTE: The first column of your data must be setup as three or more dependent variables, while the next column(s) in your data set should include your independent variables (e.g., GPA, etc.):
The sample data shown above is found in QI Macros Help > Open QI Macros Sample Data > statistical.xlsx > Multinomial Logistic Regression tab
- Next, click on the QI Macros menu and choose Statistical Tools > Regression & Other Statistics > Logistic Regression:
-
Evaluate the Logistic Regression results. The comparison variable is "B" and the Coefficients are in cells A3:E5:
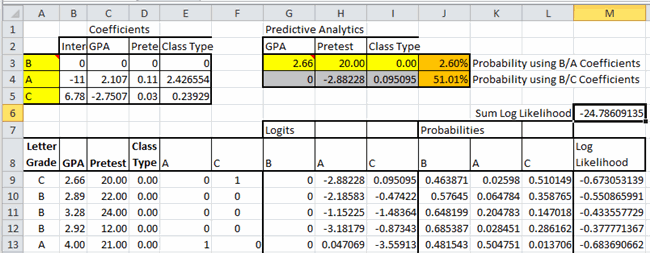
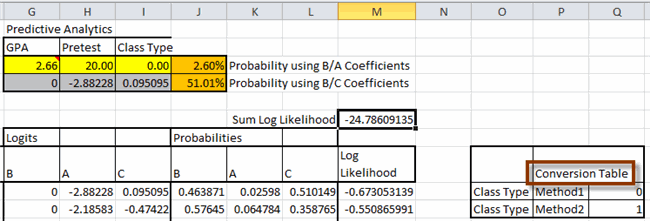
The formulas necessary to use Solver to get the Coefficients are shown in cells E9:M13.
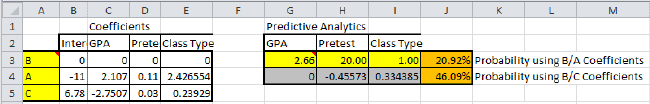
Users can change the data in G3:I3 to evaluate their probabilities! If we change class type to (1), the probability of passing goes from 2.6% to 20.9%:
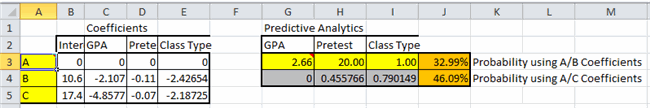
Users can also change the ordering of the dependent variables (A3:A5) and rerun Solver to use a different comparison variable:
Excel's Solver add-in is used to perform the Coefficients calculations. It must be installed using File-Options-Add-ins.
If Solver is not enabled in your Excel, OR you are using a Mac, you will be provided with information about how to calculate the Coefficients manually, using Solver.
If the independent variables columns contain text or symbols instead of numbers, these will be converted to numbers for analysis:

The resulting Multinomial Logistic Regression will provide a conversion table:
In this example:
- The probabilities of passing the test are derived from past data.
- GPA, pretest results, and class time can be used to predict a student's grade.
Why am I receiving #NUM in my regression output?
You are receiving this output, because your Constraint(s) in Solver need to be either updated or included in your worksheet. This is due to the EXP calculation crashing within Excel.
To add Constraints:
- Select Data > Solver in your worksheet.
- Choose the Constraint you want to update and select "Add."
- Select the bottom row in your Coefficients table (e.g., cells B4:E4), choose <=, and input 500 as your upper Constraint.
- Next, select OK - your upper Constraint has now been added.
- If your outputs change to values, continue to update the Constraint to the largest value possible before the output values change back to #NUM - then revert the Constraint back to the largest value.
To update Constraints:
- Select Data > Solver in your worksheet.
- Choose the Constraint you want to update and select "Change."
- Next, update your upper Constraint value - start by changing the Constraint to 300 to see if your #NUM output changes to values.
- If your outputs change to values, continue to update the Constraint to the largest value possible before the output values change back to #NUM - then revert the Constraint back to the largest value.
NOTE: At this time, we offer Binomial Logistic Regression and Multinomial Logistic Regression.
We do not currently offer Ordinal Logistic Regression.
*Functionality introduced in the October 2023 version of QI Macros*
