Struggling With Choosing the Right Chart or Statistic?
QI Macros Has Built-in Rules So You Don't Have to Memorize Them
- Confused about which chart or statistic to choose?
- Not sure how to organize or summarize thousands of rows of data?
- Just need to understand what the data is telling you?
You are not alone. Most Six Sigma training is designed to turn people into mathemagicians or statisticians!
That's Why We Created QI Macros Wizards
They eliminate the learning curve and take the guess work out of analyzing and charting your data. The wizards are easy to spot on the QI Macros Menu:
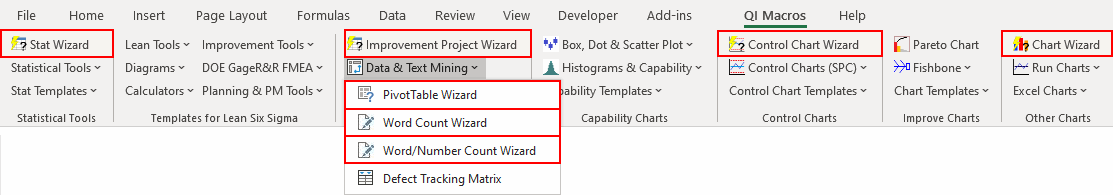
Here's What QI Macros Wizards Can Do In One Click
Creates an improvement project from a table of raw data including:
- A pivot table and XmR control chart
- Paretos by defect categories and 2nd level Paretos where found
- Fishbones with problem statements
Selects and runs the right control chart for you from this list of Shewhart control charts:
- c, np, p, u
- XmR, XbarR or XbarS
Selects and runs all possible charts from your data.
It saves you time and mistake proofs the chart selection process. Spend your time on more important things like analyzing the charts after they are drawn.
Will take up to four columns of tabular data and summarize them using Excel's PivotTable function.
I have found that almost everyone is baffled by how to use PivotTables, but all of my multimillion dollar improvement projects have sprung from PivotTable Analysis.
Counts words or numbers in a range of text or data, and creates a pivottable to count the instances of one and two word phrases or numbers.
Use this to analyze call center notes, customer reviews and other text.
Selects and runs the right hypothesis test for you. Tells you if your:
- data is normal
- variances are the same or different
- means are the same or different
Decision Trees are Not Wizards
Other software packages may claim to have wizards. But, you'll find they are really just referring to decision trees. You'll still need to understand the statistical terms in their trees.
Due to its unique design, QI Macros is the only SPC, Six Sigma or Statistical software that does all of the work for you.
Stop Struggling with Charts and Statistics!
Start creating your Charts and Statistics in just minutes.
Download a free 30-day trial. Get Charts and Statistics now!
Other Reasons to Choose QI Macros
![]()
Faster to Learn
and Easier to Use
- Works right in Excel
- Create charts in seconds
- Easy to customize & share charts
- Free Training Anytime
![]()
Proven and Trusted
- More than 100,000 users
- In More than 80 countries
- Five Star CNET Rating - Virus free
![]()
Affordable
- Only $379 USD
Quantity Discounts Available - No annual subscription fees
- Free technical support
