Struggling with Which Control Chart to Choose?
QI Macros Takes the Guesswork out of Selecting the Right Control Chart
No Other Software Can Do This!
You'll Never Struggle with Choosing the Right Control Chart Again
- QI Macros Control Chart Wizard will analyze your data and select the right control chart for you.
- It saves you time and mistake proofs the control chart selection process.
- Spend your time on more important things like analyzing the control chart after its drawn.
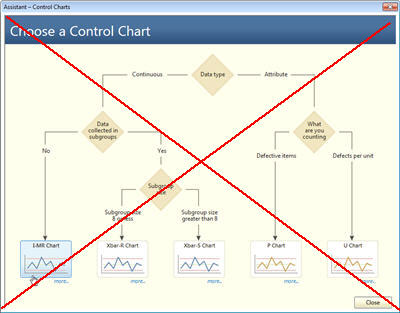
No More Decision Trees
Rather than navigating your way through a forest of decision trees like the ones in Minitab®, wouldn't it be great if the decision tree was already coded into the software? In QI Macros, it is!
Use This
Not This
QI Macros does what a tool is supposed to do; make the task easier and deliver results when you need them. Thanks for supporting our efforts in process control, continuous improvement and building a culture of Quality.
- Roger Savage
Quality Assurance Manager Molson Coors
QI Macros Control Chart Wizard is super easy to use
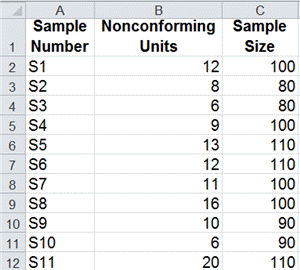
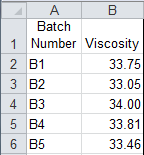
- Just select your data:
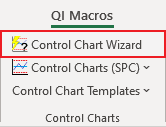
- Then select the Control Chart Wizard from the QI Macros menu:
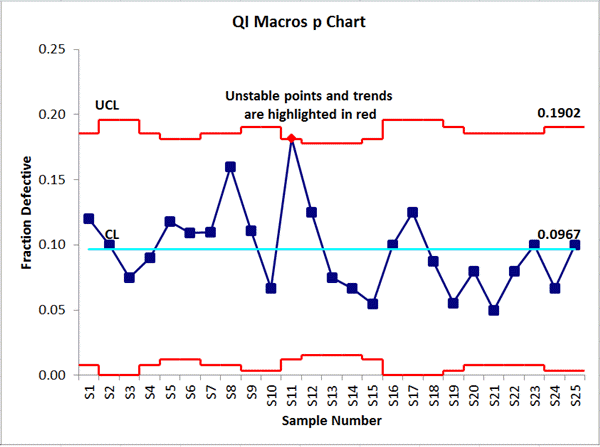
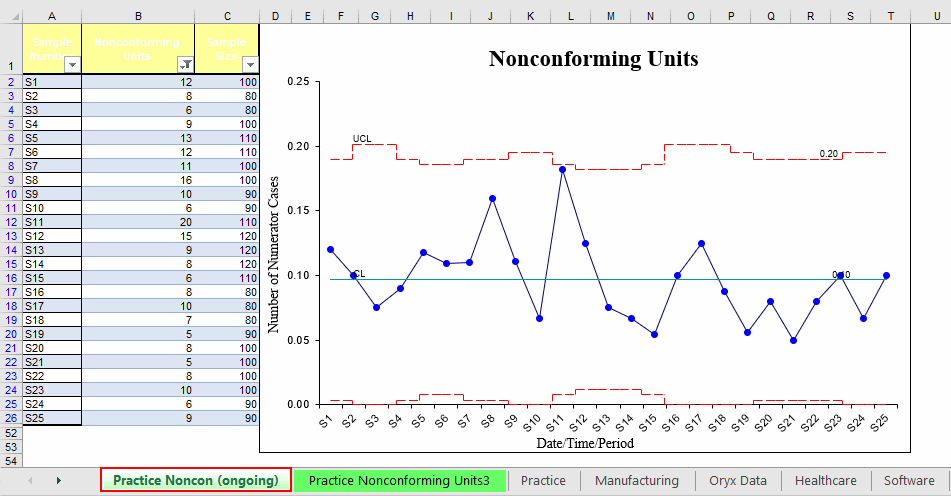
- The Control Chart Wizard will analyze your data and select the right control chart for you, while also producing a template version of the control chart that was selected:
- The wizard will also provide you with a Control Chart Template (the tab will be listed as "ongoing"). This option is given, in case the end user has an ongoing project and intends to continually add data to their Control Chart(s):
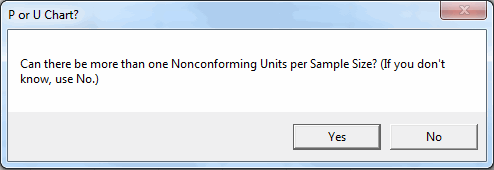
If the program is trying to choose between a p Chart and a u Chart, you will be asked the following question:
Answer "yes" for a u Chart and "no" for a p Chart.
NOTE: The XbarS template output for the Control Chart Wizard can process a maximum of (32) columns of data.
If your data includes (250) or more rows, a template will not be produced.
How does QI Macros Control Chart Wizard know how to select the right control chart?
We've built the control chart selection rules right into the QI Macros code:
# of Data Columns
|
Data Type
|
Sample size
|
>1 defect per sample? |
Control Chart Selected
|
Data Example
|
| 1 | Integers (attribute) | c Chart | 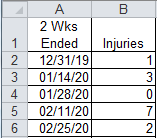 |
||
| 1 | Decimals (variable) | XmR Chart |
 |
||
| 2 | Integers (attribute) | constant | np Chart |
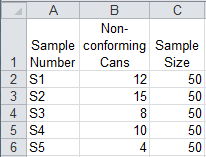 |
|
| 2 | Integers (attribute) | varying | No | p Chart |
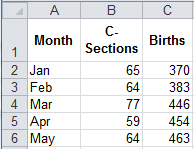 |
| 2 | Integers (attribute) | varying | Yes | u Chart |
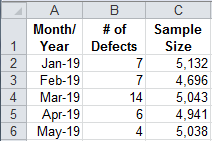 |
| 2-5 | Decimals or integers | XbarR Chart | 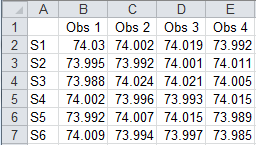 |
||
| 6+ | Decimals or integers | XbarS Chart | 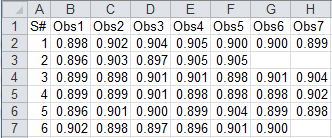 |
We just completed our JCAHO review and received a 98 with NO time 1's so we are very excited and fired up about that. Our ability to use the control charts and talk with staff about them really helped!
- Leana Hilde RN
Methodist Medical Center
Learn More...
- Statistics Wizard chooses the right statistical test
- Improvement Project Wizard creates an improvement story
- List of all AI wizards available in QI Macros
Why Choose QI Macros Over Other Control Chart Software?
![]()
Faster to Learn
and Easier to Use
- Works right in Excel
- Create charts in seconds
- Easy to customize & share charts
- Free Training Anytime
![]()
Proven and Trusted
- More than 100,000 users
- In More than 80 countries
- Five Star CNET Rating - Virus free
![]()
Affordable
- Only $379 USD
Quantity Discounts Available - No annual subscription fees
- Free technical support
