Trying to Create an np Control Chart in Excel?
QI Macros can draw an np chart for you in seconds!
Create an np Chart using QI Macros:
- Select your data.
- Click on QI Macros menu > Control Charts (SPC) > Attribute > np.
- QI Macros will do the math and draw the graph for you.
Use np Charts when counting defective items and sample size is constant.
The np Chart is useful when it's easy to count the number of defective items and the sample size is always the same. Examples might include: the number of defective circuit boards per 1000 or incorrect invoices per each sample of 50.
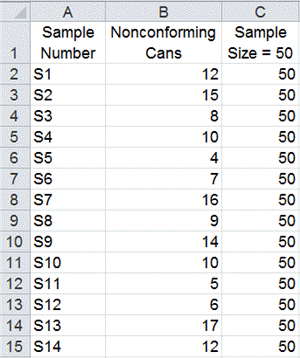
Example of np Chart data
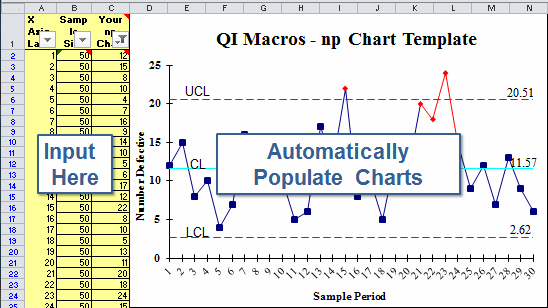
Example of an np Chart created using QI Macros

QI Macros also has an np chart template
Just drop your data into the yellow shaded cells and the chart is drawn to the right. When you have enough data points, run stability analysis using the chart tools menu.
I looked at a number of alternatives (some much more expensive than QI Macros, some in the same price range); QI Macros was head and shoulders above the competition in price/performance.
- Robert Bamford
Software Systems Quality Consulting
Stop Struggling with np Charts!
Start creating your np Charts in just minutes.
Download a free 30-day trial. Get np Charts now!
QI Macros Draws These Charts Too!
