Trying to Create Hotelling T2 Charts in Excel?
QI Macros can create them for you in seconds!
Use a Hotelling T2 chart when you want to evaluate two interacting measurements simultaneously.
To draw a Hotelling T2 Chart using QI Macros:
- Select your data.
- Click on QI Macros menu > Control Charts (SPC) > Special> Hotelling T2.
- QI Macros will do the math and draw the chart for you.
What is a Hotelling Chart?
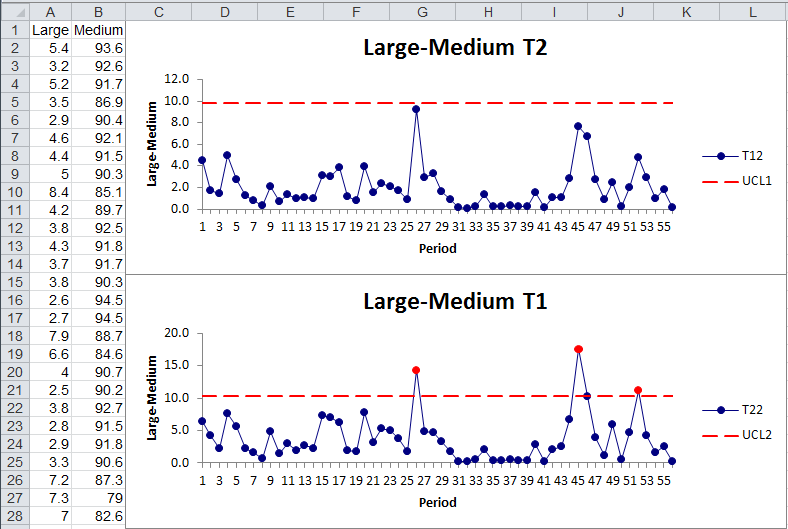
Similar to the XmR Chart, the Hotelling T2 Chart evaluates the covariances of the ranges between each of the two measures and the covariances of the actual data points. This gives two charts that are similar to the average and Range in the XmR.
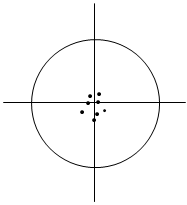
Imagine for a moment that you are measuring the location of a hole drilled in a sheet of metal. It could be left or right, up or down. It's possible that both measurements, taken separately, could be stable and predictable, but the two together could have outliers.
Example of QI Macros Hotelling T2 charts.
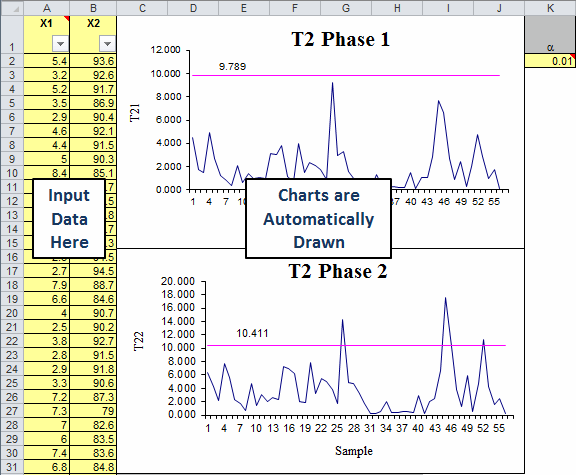
Hotelling Chart Template in QI Macros for Excel:
Find the Hotelling Chart template by clicking on the QI Macros menu > Control Chart Templates > Special > Hotelling Chart. Input your data into the yellow shaded cells and the charts are automatically drawn for you.
Stop Struggling with Hotelling T2 Charts!
Start creating your Hotelling T2 Charts in just minutes.
Download a free 30-day trial. Get Hotelling T2 Charts now!
QI Macros Draws These Charts Too!
