Want to draw a q Chart but don't know how?
QI Macros can draw q charts for you in seconds!
What is a q chart?
A quality chart (q chart) is used to evaluate process stability when counting the fraction conforming.
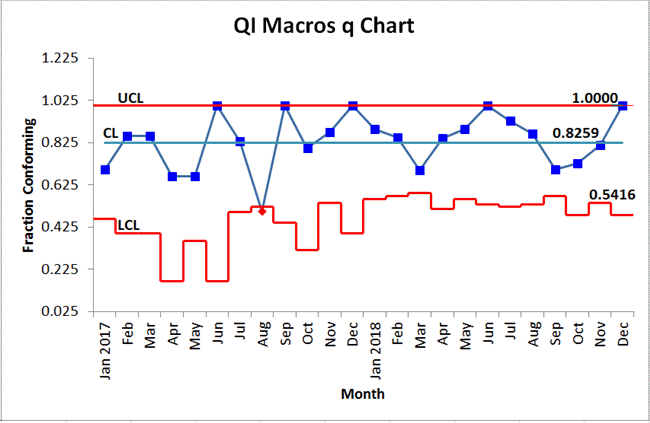
Example of a q Chart creating using QI Macros add-in for Excel.

The q Chart is used when counting the number of conforming items in a sample versus counting the number of defects in a sample as in the p Chart. q= (1-p). Therefore the UCL and sigma lines can never be greater than 100%.
To run a q Chart in QI Macros, just select your data and run the p Chart.
Stop Struggling with q Charts!
Start creating your q Charts in just minutes.
Download a free 30-day trial. Get q Charts now!
QI Macros Draws These Charts Too!

