Trying to Draw a u Chart in Excel?
QI Macros Can Do It For You!
Create a u Chart using QI Macros
- Select your data.
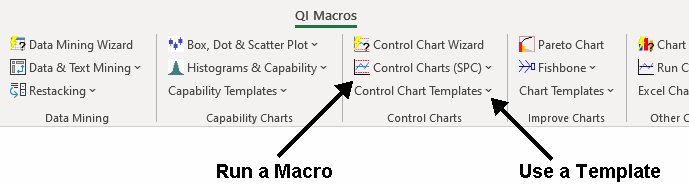
- Click on QI Macros menu > Control Charts (SPC) > Attribute > u.
- QI Macros will do the math and draw the graph for you.
Listen to our u Chart podcast below!
* Generated using QI Macros' source material via an AI model *
Use u Charts when counting defects and the sample size varies
u Charts determine stability of "counted" data (e.g., errors per bill, dents in a car door, etc.) when there can be more than one defect per unit and the sample size varies.
u Chart data looks like this:
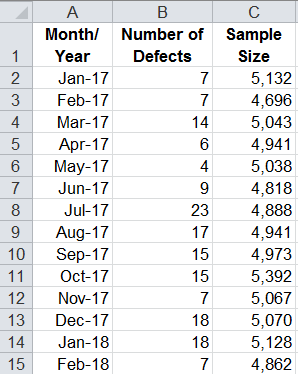
Example of a u Chart created by QI Macros:
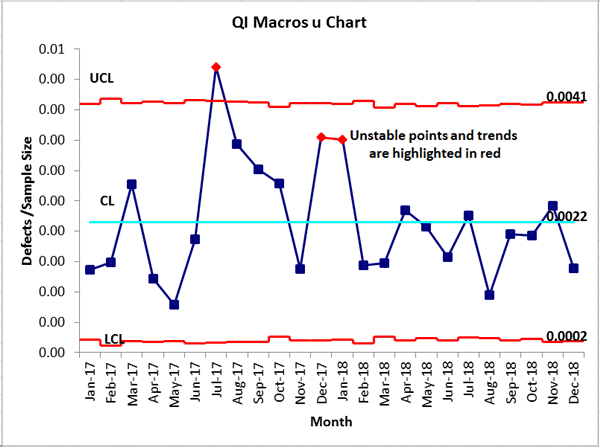
Uneven control limits result from the varying sample sizes.
It's Easy to Draw a u Chart in Excel Using QI Macros
QI Macros adds a new menu to Excel and provides two ways to create charts: a u Chart macro and a u Chart template:
I purchased QI Macros just to run control charts (worth the price just for that). I had NO idea what a robust product you have developed, and what an amazing bargain I was getting. File me under exceeded customer expectations.
- Scott Campbell
SwedishAmerican Hospital
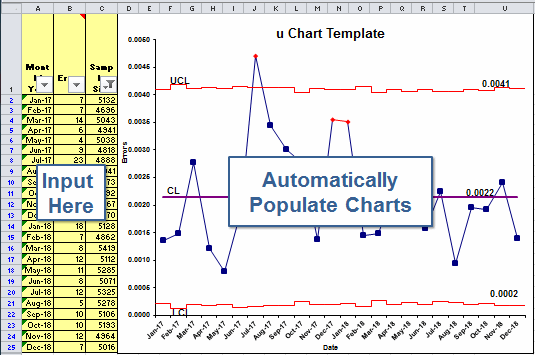
Create a chart using a u Chart template:
- Open a template: QI Macros > Control Chart Templates > Attribute > u Chart
- Input your data into the yellow shaded area.
- The chart is drawn as the data is input.
- Run stability analysis using the chart tools menu.
What is the difference between defects and defective items?
Defects - u Charts
Each item can have more than one defect: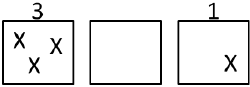
- scratches on a car door
- errors on a bill
- missing products in a shipment
Defective Items - p Charts
Each item is only counted once: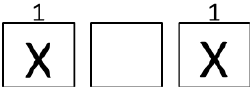
- car doors that need to be repainted
- bills that are wrong
- incomplete shipments
Learn More...
Stop Struggling with u Charts!
Start creating your u Charts in just minutes.
Download a free 30-day trial. Get u Charts now!
QI Macros Draws These Charts Too!
