Formats and Calculations Unique to p and u Charts
QI Macros Special Features for p and u charts
1. p Chart UCL and LCL Limits
Since the p chart is a fraction defective chart, the UCL is limited to 100% and the LCL is limited to 0%
2. Toggle Between p Chart and p' Chart:
Specifically offered in the p Chart macro, you can toggle between a p Chart and a p' Chart by inputting either "False" (p Chart) or "True" (p' Chart). This option is located to the right of your chart:
![]()
3. p Chart Calculations Change for Small Sample Sizes
In certain cases, the standard formulas for control limits on the p chart cannot be used. This condition exists when:
n × pbar < 5
QI Macros p chart template contains a tab for these instances:
![]()
4. Change the Y-Axis Multiplier on p and u chart templates
Located to the right of the chart, this functionality allows you to change the Y-Axis using a multiplier. For example, instead of fraction defective, you might want to show values per 100 or 1,000.
![]()
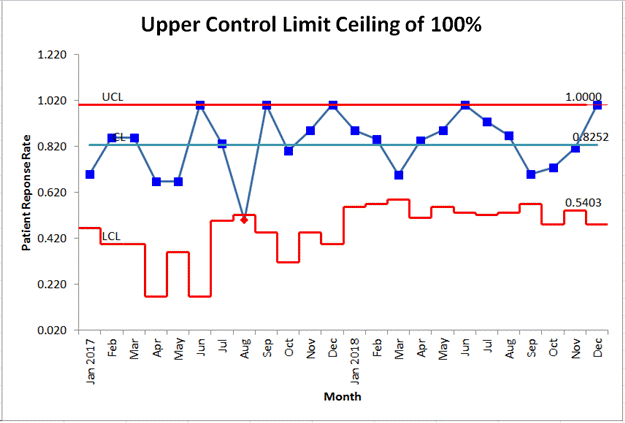
5. Automatically convert Y-Axis, UCL, and CL values to percents on p and u chart templates
If you would like to automatically convert your Y-Axis, as well as the Data Labels for your Upper Control Limits and Center Line to percentages, click on the "Conver to Percent" macro button in the P Chart, P Chart Wave-Sky, U Chart, and U Chart Wave-Sky templates.
Stop Struggling with Control Charts!
Start creating your Control Charts in just minutes.
Download a free 30-day trial. Get Control Charts now!
QI Macros Draws These Charts Too!
