When Should You Recalculate Control Limits?
QI Macros Process Change Wizard adjusts limits automatically.
Show Process Changes on Control Charts using QI Macros:
- Click on a Control Chart.
- Click on QI Macros Chart menu > Process Change Wizard.
- QI Macros find any runs and trends in the data and adjust the chart for you..
Can you determine if a process change has occurred?
Based on calls to our tech support line, most folks do not know when they should recalculate control limits on a control chart. The short answer is: when the process changes. But what if you are not sure if your process has changed?
QI Macros Can Help!
- QI Macros Process Change Wizard will analyze your data and identify potential runs and/or trends.
- QI Macros built-in rules mistake proof the process change (runs and trends) recognition process.
- QI Macros wizard automatically recalculates the control limits and reruns stability analysis saving you tons of time.
You will look like an expert and will have extra time to spend investigating what the chart tells you rather than just drawing it.
To Use QI Macros Process Change Wizard
- Select your chart:
- Then, choose the "Process Change Wizard" tool from QIMacros Chart menu > "Control Chart Tools" section:
- The Process Change Wizard will analyze your data and change control limit calculations based on where it identifies runs and/or trends in your data. It will also re-run stability analysis with the new limits. These changes to control limit calculations are referred to using various terms including: steps, phases and stages:
- Once you have run the Process Change Wizard on your chart, if it found Trends/Runs and implemented Process Change(s), run the Process Change Wizard again! It may locate additional Trends/Runs within your updated chart.
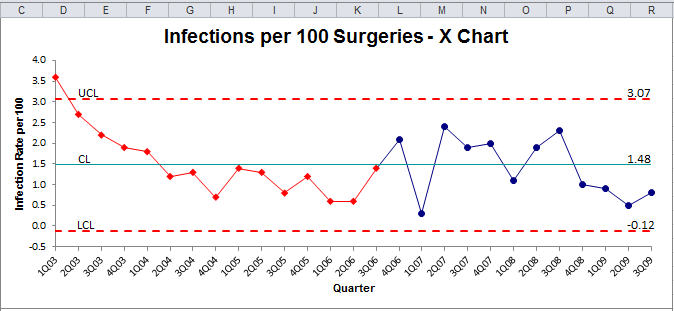
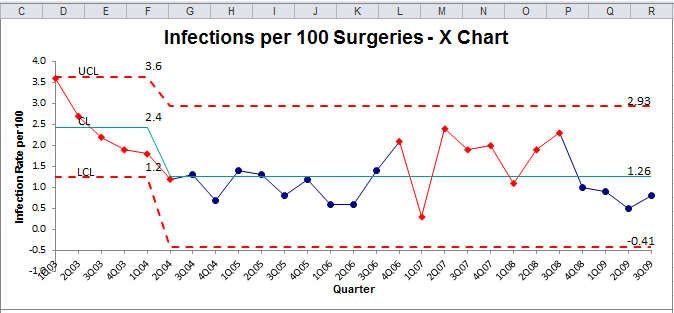
NOTE: In the original X Chart, there were (10) points below the Center Line ("2Q 04" thru "3Q 06"), which violates Control Chart Rule #4, "n points in a row above or below center line." Because of this, the Process Change Wizard made an informed observation that perhaps some type of change occurred w/in your process, and inputted a Process Change.
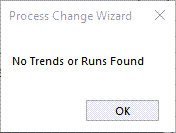
And if it finds additional Trends/Runs, run the Wizard until you receive the prompt, "No Trends or Runs Found":
Note: QI Macros Process Change Wizard uses Rules #4 and #5 from the control chart rules currently selected by the end user. QI Macros defaults to Montgomery Rules, but these can be changed.
Also, the PCW goes off the initial Stability Analysis findings and implements Process Changes accordingly.
For instance, the PCW does NOT perform Stability Analysis, then inputs a Process Change, re-analyzes Stability, and adds a secondary Process Change, if additional runs/trends are found. The Wizard looks at the entirety of the original data set and then, based off the initial Stability Analysis, inputs Process Changes accordingly.
Please keep in mind that if you perform a Fix Control Limits on your chart, the Process Change Wizard will not find and indicate runs or trends in your data set or on your chart.
For XmR, XbarR, and XbarS charts, only use the Process Change Wizard on the X charts - never the barR or barS charts.
Remove Process Change
*Functionality included in the 2022.10 version of QI Macros*
If you added a process change and later need to remove the shift or put the shift in a different location:
- Click on the point where the process change has been implemented.
- And from the QIMacros Chart menu, click on the "Process Changes" drop-down menu and select "Process Change-Show/Remove". - DO NOT perform Remove Process Change on R Chart for XmR/XbarR/XbarS – only on X Charts -
- The process change will then be removed from your chart and your limits will be automatically recalculated!
NOTE: In versions of QI Macros prior to the 2022.10 release, if you wish to remove a process change from your data set, select the chart and choose "Recalculate UCL/LCL" from the "Process Changes" drop-down - this will reset all limit calculations and remove all process change(s). And once you have done so, click on your chart and select "Analyze Stability".
Bimodal Distributions
If your data set has a bimodal distribution (2 centers of data or multiple peaks), QI Macros' Process Change Wizard will make its best guess to provide process change recommendations. However, if you find that the wizard does not recommend ALL instances where you believe a process change should be placed, run a Histogram on your data set:
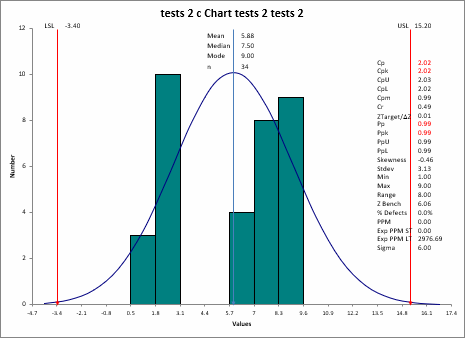
Does your data set have (2) clear centers of data or multiple peaks? If so, your data set's distribution is bimodal and you may need to input your own, additional process changes.
Stop Struggling with Control Charts!
Start creating your Control Charts in just minutes.
Download a free 30-day trial. Get Control Charts now!
QI Macros Draws These Charts Too!
