Choose which control limits to show or hide on a control chart.
QI Macros "Show - Don't Show 1 & 2 Sigma Lines" Makes it Easy.
Note: It's important to note that displaying or not displaying control limit lines does NOT change calculations or the application of control chart rules.
Control limit display options in QI Macros
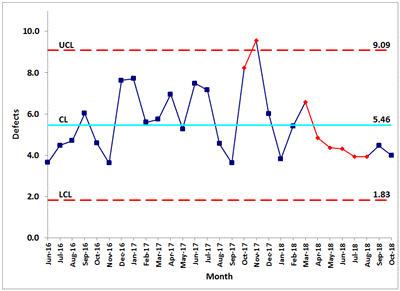
Default Control Chart: only CL, UCL and LCL Visible
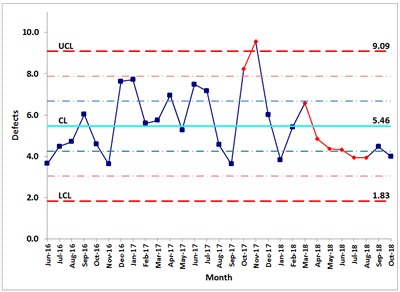
Control Chart with all Control Limits Visible
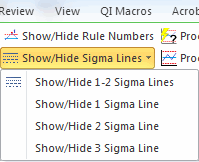
How to turn on and off the 1-2 sigma lines using QI Macros
After you have selected a chart, click on the "QIMacros Chart" menu and select "Show/Hide Sigma Lines." Within the drop-down menu, you will have 4 Show/Hide Sigma Lines options. QI Macros will update the chart and all charts you run after that:
Note: You only need to set your preference once. It will be retained even if you close Excel and/or restart your computer.
Stop Struggling with Control Charts!
Start creating your Control Charts in just minutes.
Download a free 30-day trial. Get Control Charts now!
QI Macros Draws These Charts Too!
