How to Add Control Limit Labels to a Point on a Control Chart
QI Macros Makes it Easy!
Why It Matters: You may want to add Control Limit labels to a point to provide further explanation about your data.
To add Control Limit data labels to a specific point:
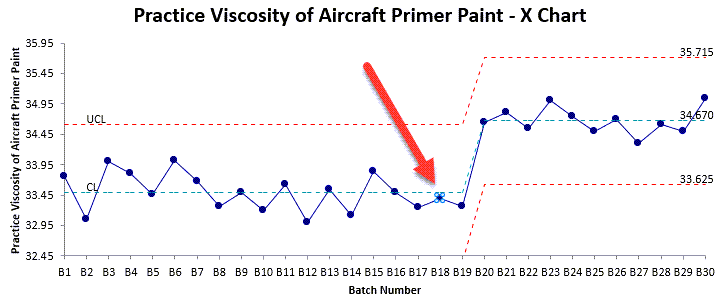
- Click on your point:

Tip: The first time you click on a point, Excel will select the whole line. Click on the point a second time to select just the point. If you have done this correctly, Excel will highlight your point.
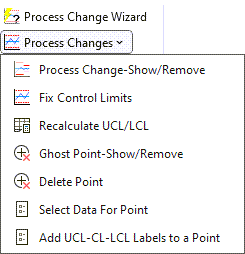
- Select the QI Macros Chart menu and select Process Changes > Add UCL-CL-LCL Labels to a Point:

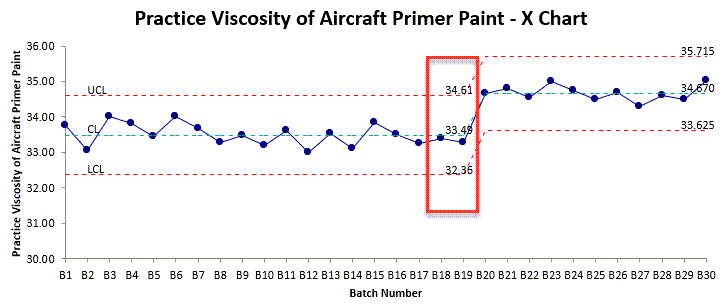
- Data Labels will be added to the Upper Control Limit, Center Line, and Lower Control Limit:

NOTE: Use Excel's format tools to increase the font, bold the text and add color.
* Functionality introduced in the April 2024 QI Macros release *
Stop Struggling with Control Charts!
Start creating your Control Charts in just minutes.
Download a free 30-day trial. Get Control Charts now!
QI Macros Draws These Charts Too!

