Need to find a point on a chart in your data set?
QI Macros "select data for point" feature makes it easy.
Why it Matters:
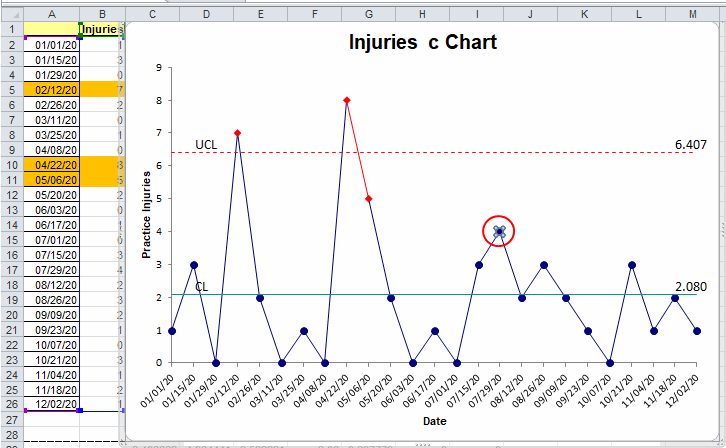
Once you draw a control chart using QI Macros, you may want to research a data point that looks odd. When you have lots of data points on a chart, its hard to identify which point you want to investigate using the x axis labels. That is why we created the "Select Data for Point" feature.
Here's how to locate your data using the "Select Data for Point" function:
- Once you have drawn a Control Chart, click on the point you are interested in:
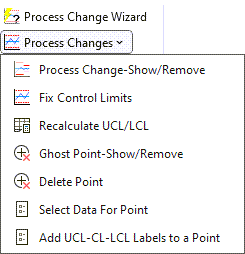
- Next click on Select Data for Point which is located under the "Process Changes" drop-down menu:
- Once you have done so, your cursor will move to the x-axis label associated with that data point:
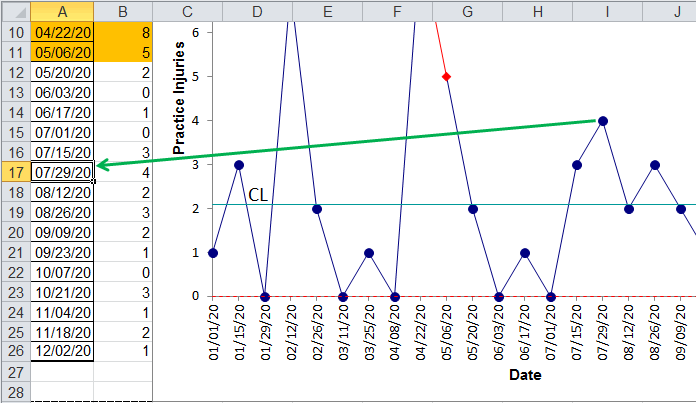
In this example, the cursor ends up in cell A17 so we know that data for July 29, 2020 is what we are interested in.
Learn More...
Stop Struggling with Control Charts!
Start creating your Control Charts in just minutes.
Download a free 30-day trial. Get Control Charts now!
QI Macros Draws These Charts Too!
