Not sure why a point on a control chart is marked unstable?
QI Macros "show - hide control chart rule numbers" tells you why.
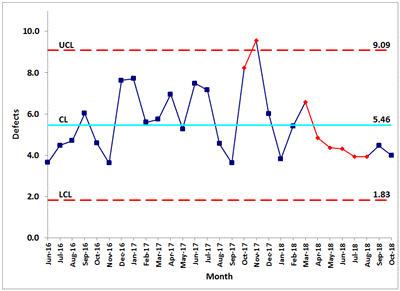
Example of a typical control chart with out of control points.
To view which control chart rules have been violated:
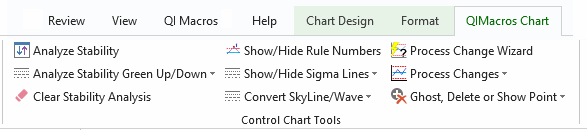
- Click on your chart and then select the "QIMacros Chart" menu to choose "Show/Hide Rule Numbers":
- QI Macros will update the chart with the control chart rule numbers that have been flagged:
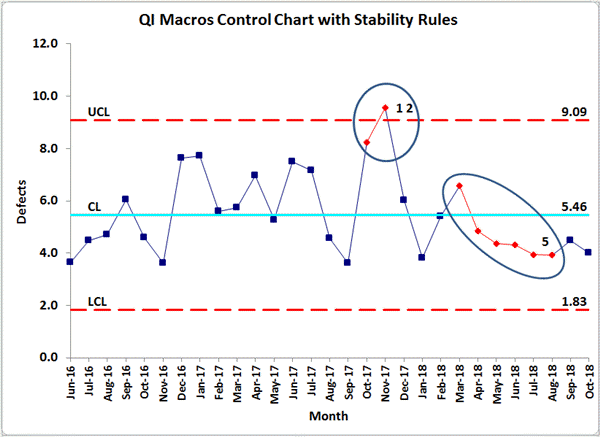
- In this case, there's one point outside the UCL (1), two points above 2 Sigma (2) and a downward trend (5).
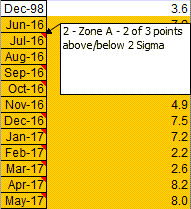
- Also, the flagged cell values will turn orange. And when you hover over the cells with a red triangle in the top right corner, you will be provided with a brief description of the violated rule(s):
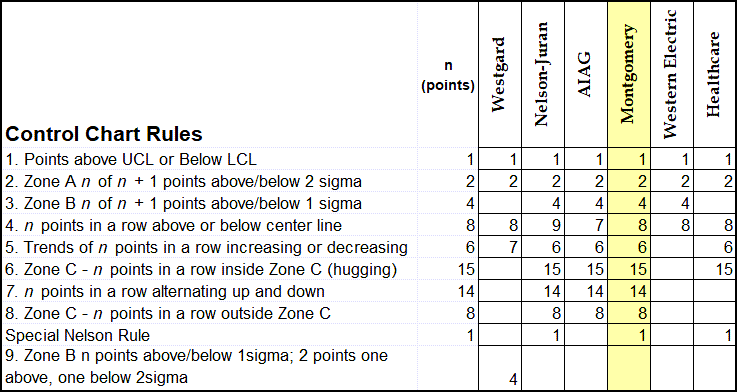
Control chart rule numbers and options in QI Macros
QI Macros defaults to Montgomery control chart rules. Use QI Macros menu to easily switch between control chart rules used by various industries.
Stop Struggling with Control Charts!
Start creating your Control Charts in just minutes.
Download a free 30-day trial. Get Control Charts now!
QI Macros Draws These Charts Too!
