Need to Recalculate UCL and LCL on Control Charts?
QI Macros makes it easy to recalculate control limits!
Recalculate Control Limits on Charts Created with a Macro
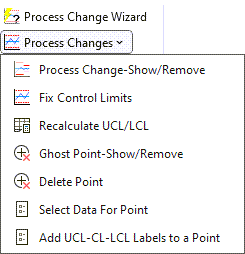
- After adding new data to a control chart, click on the chart and then click on the QI Macros Chart menu > Process Changes and then select "Recalculate UCL/LCL":
- The macros will re-calculate the control limits using all of the data points.
-
Don't forget to rerun stability analysis using the new control limits. Click on the chart sheet and then, from the QIMacros Chart menu, select "Analyze Stability." QI Macros will re-run stability analysis using the new control limits.
Recalculate Control Limits on Charts Created with a Template
QI Macros control chart templates automatically update control limits as the first 50 data points are entered. If you have more than 50 rows of data, you need to recalculate the control limits using QI Macros chart menu.
Click on the chart, click on the QIMacros Chart menu > Process Changes, and then select "Recalculate UCL/LCL":
The Recalculate UCL/LCL tool will update the limits calculations found within your template to now include the entirety of your data set.
Don't forget to rerun stability analysis using the new control limits. Click on the chart sheet and then, from the QIMacros Chart menu, select "Analyze Stability." QI Macros will re-run stability analysis using the new control limits.
Stop Struggling with Control Charts!
Start creating your Control Charts in just minutes.
Download a free 30-day trial. Get Control Charts now!
QI Macros Draws These Charts Too!
