Looking for Control Chart - Capability Templates in Excel?
QI Macros has Ready-Made Control Chart - Capability Templates for You!
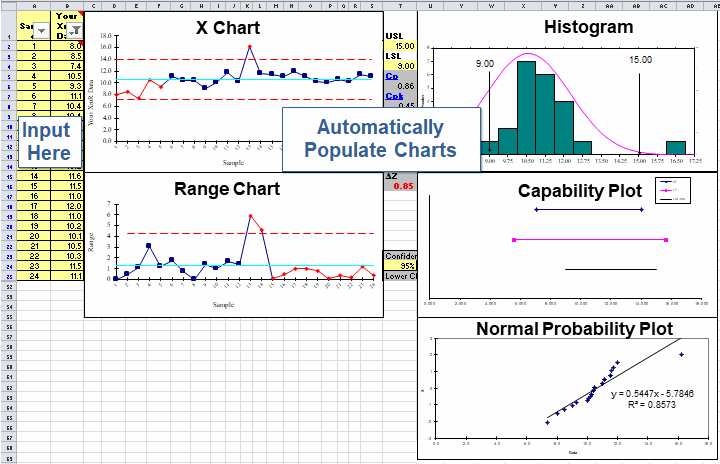
Just drop your data into the yellow shaded input area and the charts are drawn automatically.
Example of QI Macros XmR Capability Suite Template
QI Macros control chart templates:
- perform stability analysis
- can show process changes by changing control limit calculations
- include the same charts as Minitab's Capability Sixpack™
Types of control chart templates included in QI Macros add-in
Capability Suite Control Charts
Specialized Control Charts
- Pre-Control Chart
- Cusum and EWMA Charts
- Levey Jennings Chart
- g Charts and t Charts
How to use QI Macros control chart templates
QI Macros installs on Excel's menu.
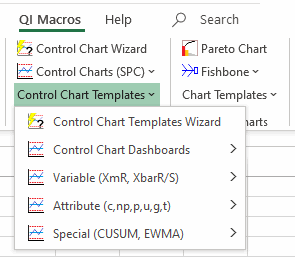
To use a template:
- Click on QI Macros > Control Chart Templates > and then the chart you want.
If you aren't sure which chart, the control chart templates wizard will analyze your data and select the right template for you. - Input your data into the yellow shaded cells.
Type directly into the cells, cut and paste or link from another worksheet. - QI Macros does the rest.
Learn more about QI Macros control chart macros versus control chart templates.
Each QI Macros control chart template has these additional features
Each template is an Excel workbook made up of several worksheets with varying options.
![]()
Control Limit Calculation Options
Stop Struggling with Control Charts!
Start creating your Control Charts in just minutes.
Download a free 30-day trial. Get Control Charts now!
QI Macros Draws These Charts Too!
