Looking for a Moving Average Chart Template in Excel?
QI Macros has a ready made Moving Average template for you!
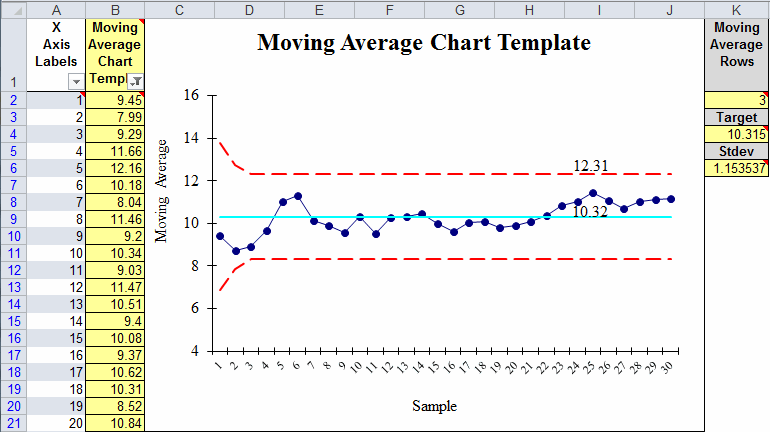
Why it Matters: Use a Moving Average and Range chart when you have one sample and want a simple moving average.
QI Macros Moving Average Template Has Three Options:
1. Moving Average Chart
- Input your data in column B
- Indicate the # of data points you want included in the moving average in cell K2 (Moving Average Period).
- Target (centerline) and standard deviation are calculated from your data but can be over written.
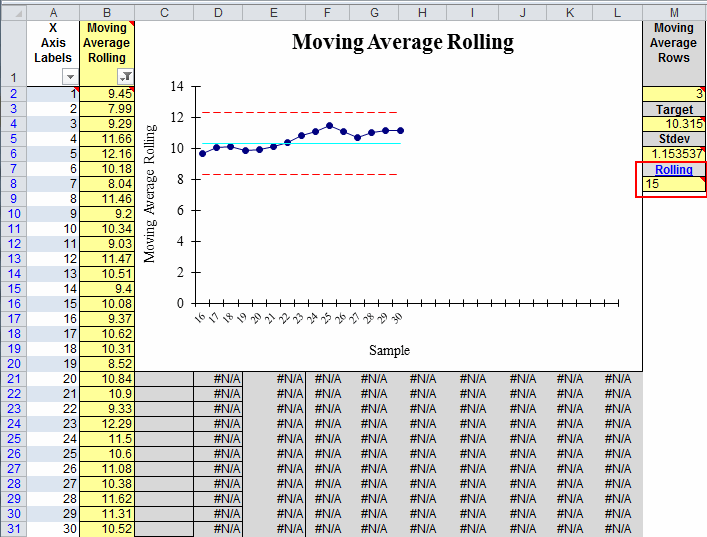
2. Moving Average Rolling
Input your data in column B, the # of points used to calculate the moving average in cell M2 and the # of the most recent data points you want on the chart in cell M8.
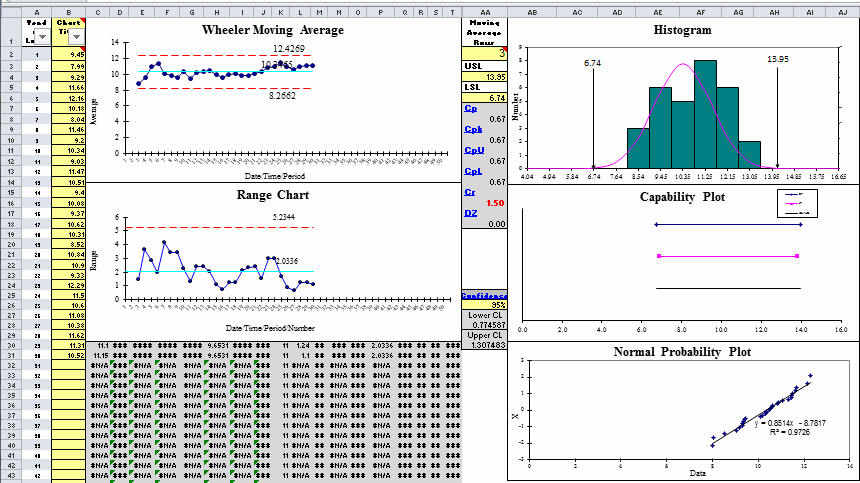
3. Wheeler Moving Average and Range
- Input your data in column B
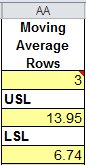
- Indicate the # of data points you want included in the moving average in cell AA2 (Moving Average Period).
- This template uses different calculations for the Moving Average chart and includes a Range chart, Histogram with Cp Cpk, Capability Plot and Probability Plot.
Find the Moving Average Chart Template
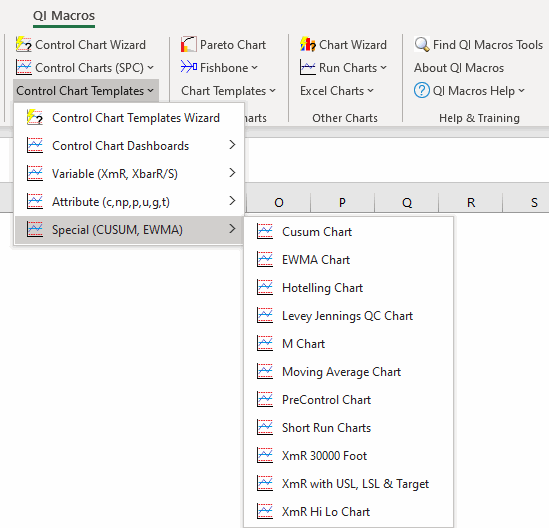
Click on QI Macros menu > Control Chart Templates > Special (CUSUM, EWMA) > Moving Average Chart:
Learn More...
Stop Struggling with Moving Average Charts!
Start creating your Moving Average Charts in just minutes.
Download a free 30-day trial. Get Moving Average Charts now!
QI Macros Draws These Charts Too!
